Sierra Leonean vs Palestinian Householder Income Ages 45 - 64 years
COMPARE
Sierra Leonean
Palestinian
Householder Income Ages 45 - 64 years
Householder Income Ages 45 - 64 years Comparison
Sierra Leoneans
Palestinians
$102,427
HOUSEHOLDER INCOME AGES 45 - 64 YEARS
74.2/ 100
METRIC RATING
159th/ 347
METRIC RANK
$107,721
HOUSEHOLDER INCOME AGES 45 - 64 YEARS
97.6/ 100
METRIC RATING
99th/ 347
METRIC RANK
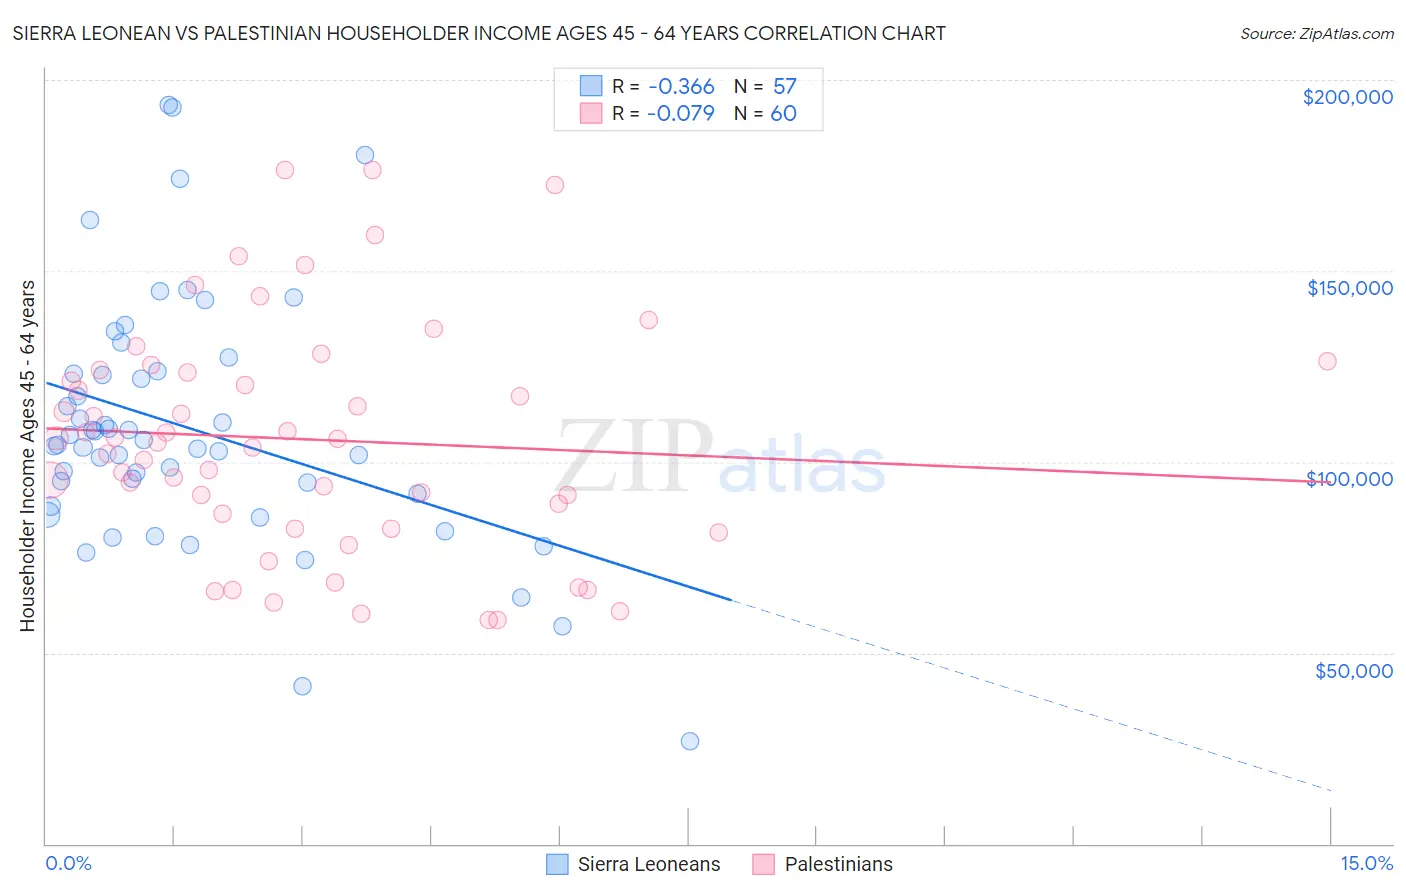
Sierra Leonean vs Palestinian Householder Income Ages 45 - 64 years Correlation Chart
The statistical analysis conducted on geographies consisting of 83,324,243 people shows a mild negative correlation between the proportion of Sierra Leoneans and household income with householder between the ages 45 and 64 in the United States with a correlation coefficient (R) of -0.366 and weighted average of $102,427. Similarly, the statistical analysis conducted on geographies consisting of 216,304,002 people shows a slight negative correlation between the proportion of Palestinians and household income with householder between the ages 45 and 64 in the United States with a correlation coefficient (R) of -0.079 and weighted average of $107,721, a difference of 5.2%.
Householder Income Ages 45 - 64 years Correlation Summary
| Measurement | Sierra Leonean | Palestinian |
| Minimum | $26,764 | $58,671 |
| Maximum | $193,348 | $176,545 |
| Range | $166,584 | $117,874 |
| Mean | $108,787 | $105,880 |
| Median | $104,388 | $105,547 |
| Interquartile 25% (IQ1) | $89,997 | $84,446 |
| Interquartile 75% (IQ3) | $123,470 | $123,759 |
| Interquartile Range (IQR) | $33,473 | $39,313 |
| Standard Deviation (Sample) | $32,726 | $30,088 |
| Standard Deviation (Population) | $32,438 | $29,836 |
Similar Demographics by Householder Income Ages 45 - 64 years
Demographics Similar to Sierra Leoneans by Householder Income Ages 45 - 64 years
In terms of householder income ages 45 - 64 years, the demographic groups most similar to Sierra Leoneans are Icelander ($102,261, a difference of 0.16%), Slavic ($102,629, a difference of 0.20%), Immigrants from Nepal ($102,190, a difference of 0.23%), Scottish ($102,123, a difference of 0.30%), and Immigrants from Ethiopia ($102,763, a difference of 0.33%).
| Demographics | Rating | Rank | Householder Income Ages 45 - 64 years |
| Irish | 79.8 /100 | #152 | Good $103,067 |
| Scandinavians | 79.0 /100 | #153 | Good $102,969 |
| Slovenes | 78.3 /100 | #154 | Good $102,885 |
| Costa Ricans | 77.4 /100 | #155 | Good $102,779 |
| Carpatho Rusyns | 77.4 /100 | #156 | Good $102,777 |
| Immigrants | Ethiopia | 77.3 /100 | #157 | Good $102,763 |
| Slavs | 76.1 /100 | #158 | Good $102,629 |
| Sierra Leoneans | 74.2 /100 | #159 | Good $102,427 |
| Icelanders | 72.5 /100 | #160 | Good $102,261 |
| Immigrants | Nepal | 71.8 /100 | #161 | Good $102,190 |
| Scottish | 71.1 /100 | #162 | Good $102,123 |
| English | 70.1 /100 | #163 | Good $102,021 |
| Immigrants | Morocco | 70.0 /100 | #164 | Good $102,015 |
| Immigrants | Albania | 69.4 /100 | #165 | Good $101,957 |
| Samoans | 65.3 /100 | #166 | Good $101,580 |
Demographics Similar to Palestinians by Householder Income Ages 45 - 64 years
In terms of householder income ages 45 - 64 years, the demographic groups most similar to Palestinians are Immigrants from Southern Europe ($107,775, a difference of 0.050%), Northern European ($107,870, a difference of 0.14%), Immigrants from Serbia ($107,569, a difference of 0.14%), Immigrants from Kazakhstan ($107,378, a difference of 0.32%), and Immigrants from Moldova ($107,357, a difference of 0.34%).
| Demographics | Rating | Rank | Householder Income Ages 45 - 64 years |
| Croatians | 98.3 /100 | #92 | Exceptional $108,383 |
| Immigrants | Croatia | 98.2 /100 | #93 | Exceptional $108,304 |
| Sri Lankans | 98.2 /100 | #94 | Exceptional $108,270 |
| Immigrants | Hungary | 98.2 /100 | #95 | Exceptional $108,267 |
| Immigrants | Argentina | 98.2 /100 | #96 | Exceptional $108,264 |
| Northern Europeans | 97.8 /100 | #97 | Exceptional $107,870 |
| Immigrants | Southern Europe | 97.7 /100 | #98 | Exceptional $107,775 |
| Palestinians | 97.6 /100 | #99 | Exceptional $107,721 |
| Immigrants | Serbia | 97.4 /100 | #100 | Exceptional $107,569 |
| Immigrants | Kazakhstan | 97.2 /100 | #101 | Exceptional $107,378 |
| Immigrants | Moldova | 97.1 /100 | #102 | Exceptional $107,357 |
| Syrians | 96.9 /100 | #103 | Exceptional $107,207 |
| Immigrants | Ukraine | 96.7 /100 | #104 | Exceptional $107,079 |
| Macedonians | 96.7 /100 | #105 | Exceptional $107,074 |
| Armenians | 96.6 /100 | #106 | Exceptional $107,002 |