Shoshone vs Immigrants from Albania Child Poverty Under the Age of 16
COMPARE
Shoshone
Immigrants from Albania
Child Poverty Under the Age of 16
Child Poverty Under the Age of 16 Comparison
Shoshone
Immigrants from Albania
18.8%
CHILD POVERTY UNDER THE AGE OF 16
0.5/ 100
METRIC RATING
245th/ 347
METRIC RANK
15.8%
CHILD POVERTY UNDER THE AGE OF 16
70.7/ 100
METRIC RATING
160th/ 347
METRIC RANK
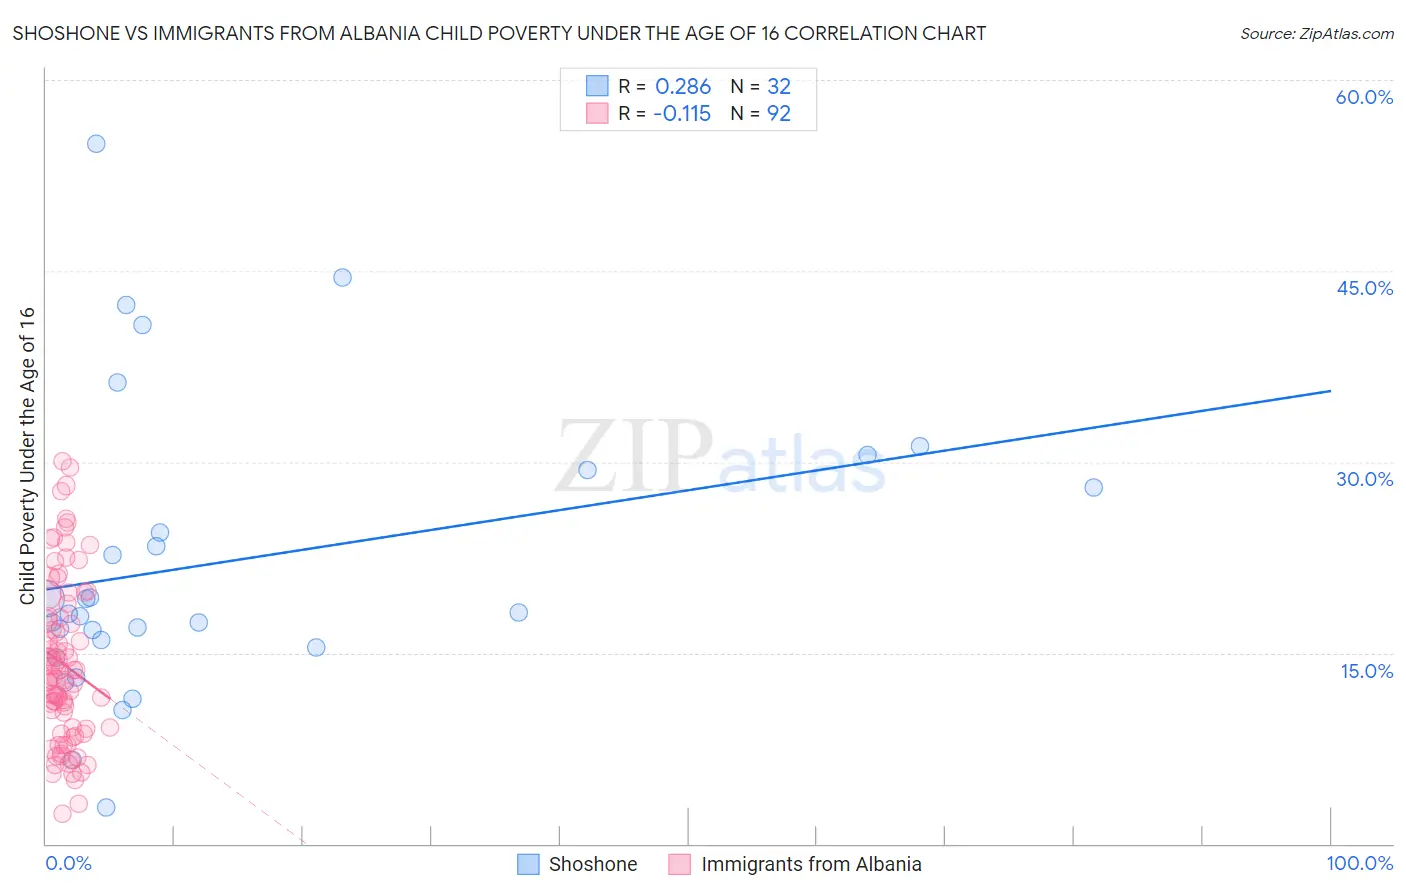
Shoshone vs Immigrants from Albania Child Poverty Under the Age of 16 Correlation Chart
The statistical analysis conducted on geographies consisting of 66,431,536 people shows a weak positive correlation between the proportion of Shoshone and poverty level among children under the age of 16 in the United States with a correlation coefficient (R) of 0.286 and weighted average of 18.8%. Similarly, the statistical analysis conducted on geographies consisting of 118,988,318 people shows a poor negative correlation between the proportion of Immigrants from Albania and poverty level among children under the age of 16 in the United States with a correlation coefficient (R) of -0.115 and weighted average of 15.8%, a difference of 19.3%.
Child Poverty Under the Age of 16 Correlation Summary
| Measurement | Shoshone | Immigrants from Albania |
| Minimum | 2.9% | 2.3% |
| Maximum | 55.0% | 30.0% |
| Range | 52.1% | 27.7% |
| Mean | 22.2% | 14.1% |
| Median | 18.1% | 13.0% |
| Interquartile 25% (IQ1) | 15.7% | 9.1% |
| Interquartile 75% (IQ3) | 28.7% | 17.8% |
| Interquartile Range (IQR) | 13.0% | 8.8% |
| Standard Deviation (Sample) | 11.6% | 6.4% |
| Standard Deviation (Population) | 11.4% | 6.3% |
Similar Demographics by Child Poverty Under the Age of 16
Demographics Similar to Shoshone by Child Poverty Under the Age of 16
In terms of child poverty under the age of 16, the demographic groups most similar to Shoshone are Immigrants from Nicaragua (18.8%, a difference of 0.030%), French American Indian (18.9%, a difference of 0.27%), Cape Verdean (18.7%, a difference of 0.65%), Ecuadorian (19.0%, a difference of 0.70%), and Immigrants from Cuba (18.7%, a difference of 0.72%).
| Demographics | Rating | Rank | Child Poverty Under the Age of 16 |
| Immigrants | Eritrea | 0.8 /100 | #238 | Tragic 18.5% |
| Immigrants | Sudan | 0.8 /100 | #239 | Tragic 18.5% |
| Ghanaians | 0.8 /100 | #240 | Tragic 18.6% |
| Alsatians | 0.7 /100 | #241 | Tragic 18.6% |
| Immigrants | Laos | 0.6 /100 | #242 | Tragic 18.7% |
| Immigrants | Cuba | 0.6 /100 | #243 | Tragic 18.7% |
| Cape Verdeans | 0.6 /100 | #244 | Tragic 18.7% |
| Shoshone | 0.5 /100 | #245 | Tragic 18.8% |
| Immigrants | Nicaragua | 0.4 /100 | #246 | Tragic 18.8% |
| French American Indians | 0.4 /100 | #247 | Tragic 18.9% |
| Ecuadorians | 0.3 /100 | #248 | Tragic 19.0% |
| Potawatomi | 0.3 /100 | #249 | Tragic 19.0% |
| Immigrants | Middle Africa | 0.3 /100 | #250 | Tragic 19.0% |
| Immigrants | Ghana | 0.3 /100 | #251 | Tragic 19.1% |
| Immigrants | Trinidad and Tobago | 0.3 /100 | #252 | Tragic 19.1% |
Demographics Similar to Immigrants from Albania by Child Poverty Under the Age of 16
In terms of child poverty under the age of 16, the demographic groups most similar to Immigrants from Albania are Immigrants from Fiji (15.8%, a difference of 0.070%), Immigrants from Chile (15.7%, a difference of 0.32%), Immigrants from Nepal (15.7%, a difference of 0.34%), Immigrants from Northern Africa (15.8%, a difference of 0.38%), and Colombian (15.8%, a difference of 0.44%).
| Demographics | Rating | Rank | Child Poverty Under the Age of 16 |
| Venezuelans | 77.4 /100 | #153 | Good 15.6% |
| Samoans | 77.3 /100 | #154 | Good 15.6% |
| Syrians | 76.1 /100 | #155 | Good 15.6% |
| Immigrants | Venezuela | 74.9 /100 | #156 | Good 15.7% |
| Immigrants | Nepal | 72.9 /100 | #157 | Good 15.7% |
| Immigrants | Chile | 72.8 /100 | #158 | Good 15.7% |
| Immigrants | Fiji | 71.1 /100 | #159 | Good 15.8% |
| Immigrants | Albania | 70.7 /100 | #160 | Good 15.8% |
| Immigrants | Northern Africa | 68.1 /100 | #161 | Good 15.8% |
| Colombians | 67.6 /100 | #162 | Good 15.8% |
| Yugoslavians | 67.6 /100 | #163 | Good 15.8% |
| Immigrants | Germany | 67.3 /100 | #164 | Good 15.8% |
| Guamanians/Chamorros | 66.4 /100 | #165 | Good 15.9% |
| Immigrants | Oceania | 65.4 /100 | #166 | Good 15.9% |
| Costa Ricans | 61.1 /100 | #167 | Good 16.0% |