Yaqui vs Delaware 2 or more Vehicles in Household
COMPARE
Yaqui
Delaware
2 or more Vehicles in Household
2 or more Vehicles in Household Comparison
Yaqui
Delaware
59.3%
2 OR MORE VEHICLES IN HOUSEHOLD
99.9/ 100
METRIC RATING
47th/ 347
METRIC RANK
58.2%
2 OR MORE VEHICLES IN HOUSEHOLD
99.4/ 100
METRIC RATING
79th/ 347
METRIC RANK
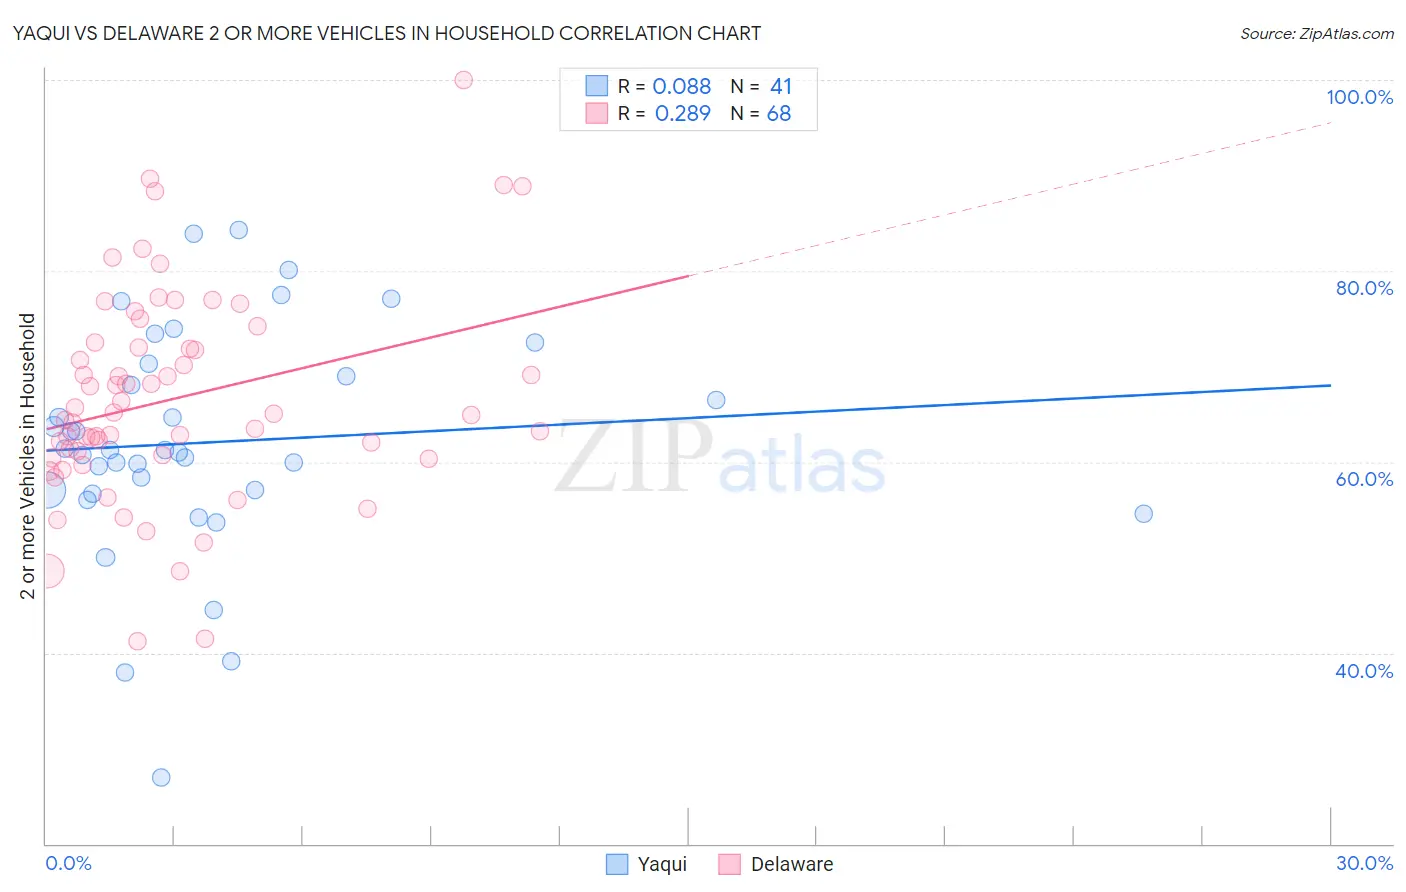
Yaqui vs Delaware 2 or more Vehicles in Household Correlation Chart
The statistical analysis conducted on geographies consisting of 107,720,236 people shows a slight positive correlation between the proportion of Yaqui and percentage of households with 2 or more vehicles available in the United States with a correlation coefficient (R) of 0.088 and weighted average of 59.3%. Similarly, the statistical analysis conducted on geographies consisting of 96,233,255 people shows a weak positive correlation between the proportion of Delaware and percentage of households with 2 or more vehicles available in the United States with a correlation coefficient (R) of 0.289 and weighted average of 58.2%, a difference of 1.9%.
2 or more Vehicles in Household Correlation Summary
| Measurement | Yaqui | Delaware |
| Minimum | 26.9% | 41.2% |
| Maximum | 84.3% | 100.0% |
| Range | 57.4% | 58.8% |
| Mean | 62.1% | 66.6% |
| Median | 61.2% | 65.0% |
| Interquartile 25% (IQ1) | 56.8% | 60.5% |
| Interquartile 75% (IQ3) | 69.6% | 72.2% |
| Interquartile Range (IQR) | 12.8% | 11.7% |
| Standard Deviation (Sample) | 11.9% | 11.1% |
| Standard Deviation (Population) | 11.8% | 11.1% |
Similar Demographics by 2 or more Vehicles in Household
Demographics Similar to Yaqui by 2 or more Vehicles in Household
In terms of 2 or more vehicles in household, the demographic groups most similar to Yaqui are Immigrants from India (59.3%, a difference of 0.020%), Belgian (59.3%, a difference of 0.060%), Choctaw (59.3%, a difference of 0.060%), Spaniard (59.2%, a difference of 0.20%), and Immigrants from Laos (59.2%, a difference of 0.21%).
| Demographics | Rating | Rank | 2 or more Vehicles in Household |
| Cherokee | 100.0 /100 | #40 | Exceptional 59.9% |
| Northern Europeans | 100.0 /100 | #41 | Exceptional 59.9% |
| Malaysians | 100.0 /100 | #42 | Exceptional 59.8% |
| Czechoslovakians | 100.0 /100 | #43 | Exceptional 59.8% |
| French | 100.0 /100 | #44 | Exceptional 59.8% |
| Immigrants | Taiwan | 100.0 /100 | #45 | Exceptional 59.7% |
| Immigrants | South Eastern Asia | 100.0 /100 | #46 | Exceptional 59.6% |
| Yaqui | 99.9 /100 | #47 | Exceptional 59.3% |
| Immigrants | India | 99.9 /100 | #48 | Exceptional 59.3% |
| Belgians | 99.9 /100 | #49 | Exceptional 59.3% |
| Choctaw | 99.9 /100 | #50 | Exceptional 59.3% |
| Spaniards | 99.9 /100 | #51 | Exceptional 59.2% |
| Immigrants | Laos | 99.9 /100 | #52 | Exceptional 59.2% |
| Celtics | 99.9 /100 | #53 | Exceptional 59.2% |
| Bhutanese | 99.9 /100 | #54 | Exceptional 59.1% |
Demographics Similar to Delaware by 2 or more Vehicles in Household
In terms of 2 or more vehicles in household, the demographic groups most similar to Delaware are Lithuanian (58.2%, a difference of 0.080%), Slovene (58.3%, a difference of 0.13%), Creek (58.3%, a difference of 0.14%), Immigrants from England (58.1%, a difference of 0.14%), and Immigrants from Iraq (58.1%, a difference of 0.16%).
| Demographics | Rating | Rank | 2 or more Vehicles in Household |
| Austrians | 99.6 /100 | #72 | Exceptional 58.4% |
| Bolivians | 99.6 /100 | #73 | Exceptional 58.3% |
| Immigrants | Afghanistan | 99.6 /100 | #74 | Exceptional 58.3% |
| Poles | 99.5 /100 | #75 | Exceptional 58.3% |
| Creek | 99.5 /100 | #76 | Exceptional 58.3% |
| Slovenes | 99.5 /100 | #77 | Exceptional 58.3% |
| Lithuanians | 99.5 /100 | #78 | Exceptional 58.2% |
| Delaware | 99.4 /100 | #79 | Exceptional 58.2% |
| Immigrants | England | 99.3 /100 | #80 | Exceptional 58.1% |
| Immigrants | Iraq | 99.3 /100 | #81 | Exceptional 58.1% |
| Iranians | 99.3 /100 | #82 | Exceptional 58.1% |
| Icelanders | 99.2 /100 | #83 | Exceptional 58.0% |
| Maltese | 99.2 /100 | #84 | Exceptional 58.0% |
| Slovaks | 99.2 /100 | #85 | Exceptional 58.0% |
| Potawatomi | 99.1 /100 | #86 | Exceptional 58.0% |