Navajo vs Bangladeshi 2 or more Vehicles in Household
COMPARE
Navajo
Bangladeshi
2 or more Vehicles in Household
2 or more Vehicles in Household Comparison
Navajo
Bangladeshis
55.3%
2 OR MORE VEHICLES IN HOUSEHOLD
50.0/ 100
METRIC RATING
174th/ 347
METRIC RANK
58.4%
2 OR MORE VEHICLES IN HOUSEHOLD
99.6/ 100
METRIC RATING
71st/ 347
METRIC RANK
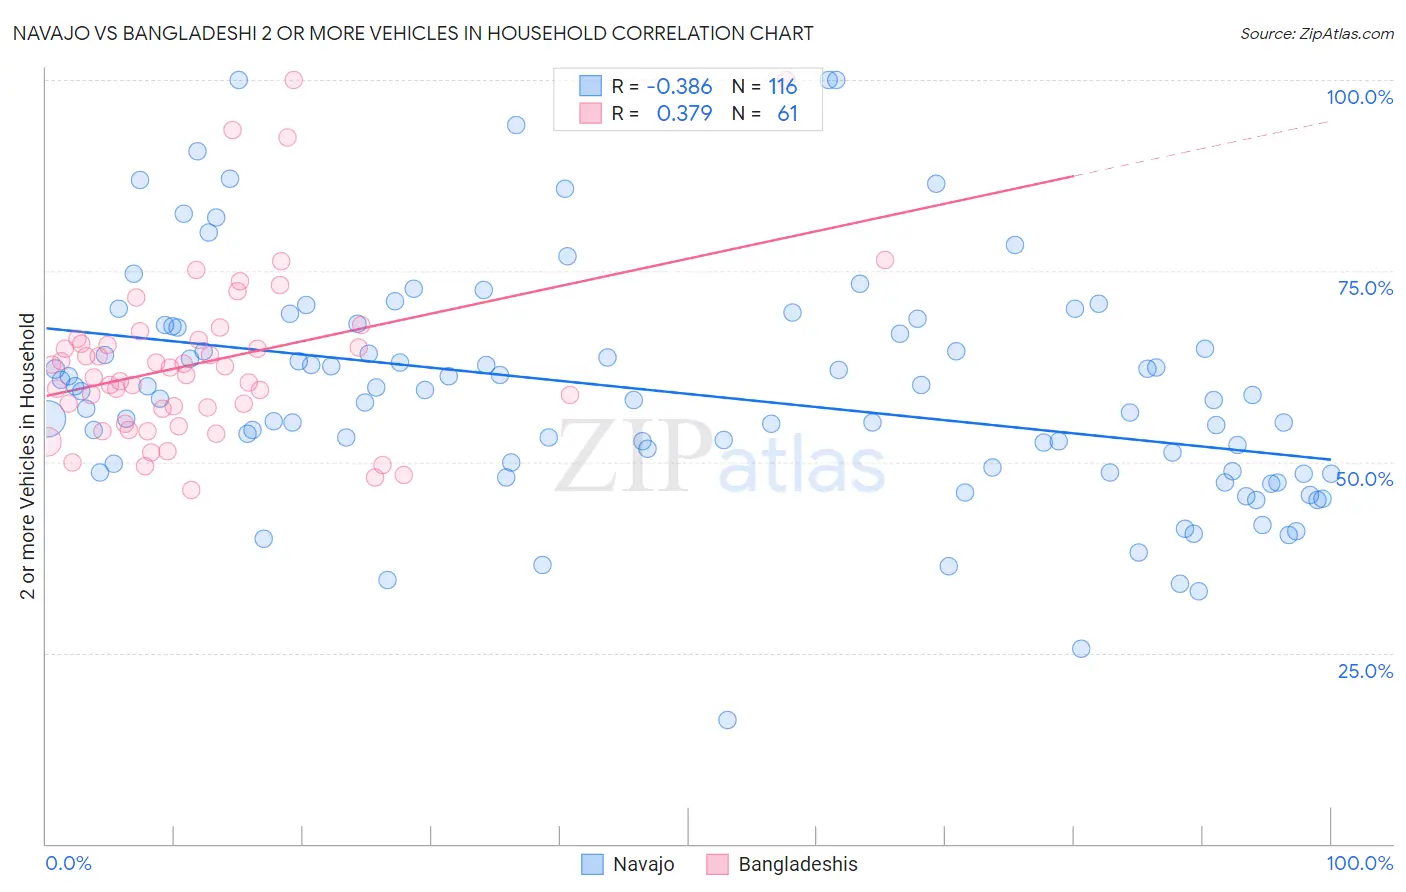
Navajo vs Bangladeshi 2 or more Vehicles in Household Correlation Chart
The statistical analysis conducted on geographies consisting of 224,763,782 people shows a mild negative correlation between the proportion of Navajo and percentage of households with 2 or more vehicles available in the United States with a correlation coefficient (R) of -0.386 and weighted average of 55.3%. Similarly, the statistical analysis conducted on geographies consisting of 141,360,423 people shows a mild positive correlation between the proportion of Bangladeshis and percentage of households with 2 or more vehicles available in the United States with a correlation coefficient (R) of 0.379 and weighted average of 58.4%, a difference of 5.6%.
2 or more Vehicles in Household Correlation Summary
| Measurement | Navajo | Bangladeshi |
| Minimum | 16.3% | 46.3% |
| Maximum | 100.0% | 100.0% |
| Range | 83.7% | 53.7% |
| Mean | 59.2% | 63.1% |
| Median | 58.5% | 61.4% |
| Interquartile 25% (IQ1) | 49.0% | 56.0% |
| Interquartile 75% (IQ3) | 67.7% | 66.0% |
| Interquartile Range (IQR) | 18.7% | 10.0% |
| Standard Deviation (Sample) | 15.1% | 11.5% |
| Standard Deviation (Population) | 15.1% | 11.4% |
Similar Demographics by 2 or more Vehicles in Household
Demographics Similar to Navajo by 2 or more Vehicles in Household
In terms of 2 or more vehicles in household, the demographic groups most similar to Navajo are Immigrants from Denmark (55.3%, a difference of 0.020%), Immigrants from Western Europe (55.4%, a difference of 0.050%), Immigrants from Nicaragua (55.4%, a difference of 0.070%), Immigrants from Cuba (55.3%, a difference of 0.12%), and Menominee (55.3%, a difference of 0.15%).
| Demographics | Rating | Rank | 2 or more Vehicles in Household |
| Kenyans | 58.1 /100 | #167 | Average 55.5% |
| French American Indians | 56.7 /100 | #168 | Average 55.5% |
| Immigrants | Austria | 56.3 /100 | #169 | Average 55.5% |
| Romanians | 55.8 /100 | #170 | Average 55.5% |
| Immigrants | Costa Rica | 54.4 /100 | #171 | Average 55.4% |
| Immigrants | Nicaragua | 51.6 /100 | #172 | Average 55.4% |
| Immigrants | Western Europe | 51.4 /100 | #173 | Average 55.4% |
| Navajo | 50.0 /100 | #174 | Average 55.3% |
| Immigrants | Denmark | 49.4 /100 | #175 | Average 55.3% |
| Immigrants | Cuba | 47.0 /100 | #176 | Average 55.3% |
| Menominee | 46.2 /100 | #177 | Average 55.3% |
| Immigrants | Sweden | 45.3 /100 | #178 | Average 55.2% |
| Alaskan Athabascans | 42.9 /100 | #179 | Average 55.2% |
| Immigrants | Kenya | 40.4 /100 | #180 | Average 55.1% |
| Immigrants | Micronesia | 38.2 /100 | #181 | Fair 55.1% |
Demographics Similar to Bangladeshis by 2 or more Vehicles in Household
In terms of 2 or more vehicles in household, the demographic groups most similar to Bangladeshis are Italian (58.4%, a difference of 0.020%), Austrian (58.4%, a difference of 0.030%), Pennsylvania German (58.5%, a difference of 0.14%), Bolivian (58.3%, a difference of 0.15%), and Immigrants from Afghanistan (58.3%, a difference of 0.16%).
| Demographics | Rating | Rank | 2 or more Vehicles in Household |
| Portuguese | 99.7 /100 | #64 | Exceptional 58.6% |
| Immigrants | Central America | 99.7 /100 | #65 | Exceptional 58.6% |
| Croatians | 99.7 /100 | #66 | Exceptional 58.6% |
| Laotians | 99.7 /100 | #67 | Exceptional 58.6% |
| Canadians | 99.7 /100 | #68 | Exceptional 58.6% |
| Pennsylvania Germans | 99.7 /100 | #69 | Exceptional 58.5% |
| Italians | 99.6 /100 | #70 | Exceptional 58.4% |
| Bangladeshis | 99.6 /100 | #71 | Exceptional 58.4% |
| Austrians | 99.6 /100 | #72 | Exceptional 58.4% |
| Bolivians | 99.6 /100 | #73 | Exceptional 58.3% |
| Immigrants | Afghanistan | 99.6 /100 | #74 | Exceptional 58.3% |
| Poles | 99.5 /100 | #75 | Exceptional 58.3% |
| Creek | 99.5 /100 | #76 | Exceptional 58.3% |
| Slovenes | 99.5 /100 | #77 | Exceptional 58.3% |
| Lithuanians | 99.5 /100 | #78 | Exceptional 58.2% |