Immigrants from Saudi Arabia vs Panamanian No Vehicles in Household
COMPARE
Immigrants from Saudi Arabia
Panamanian
No Vehicles in Household
No Vehicles in Household Comparison
Immigrants from Saudi Arabia
Panamanians
10.3%
NO VEHICLES IN HOUSEHOLD
58.8/ 100
METRIC RATING
167th/ 347
METRIC RANK
12.5%
NO VEHICLES IN HOUSEHOLD
0.2/ 100
METRIC RATING
269th/ 347
METRIC RANK
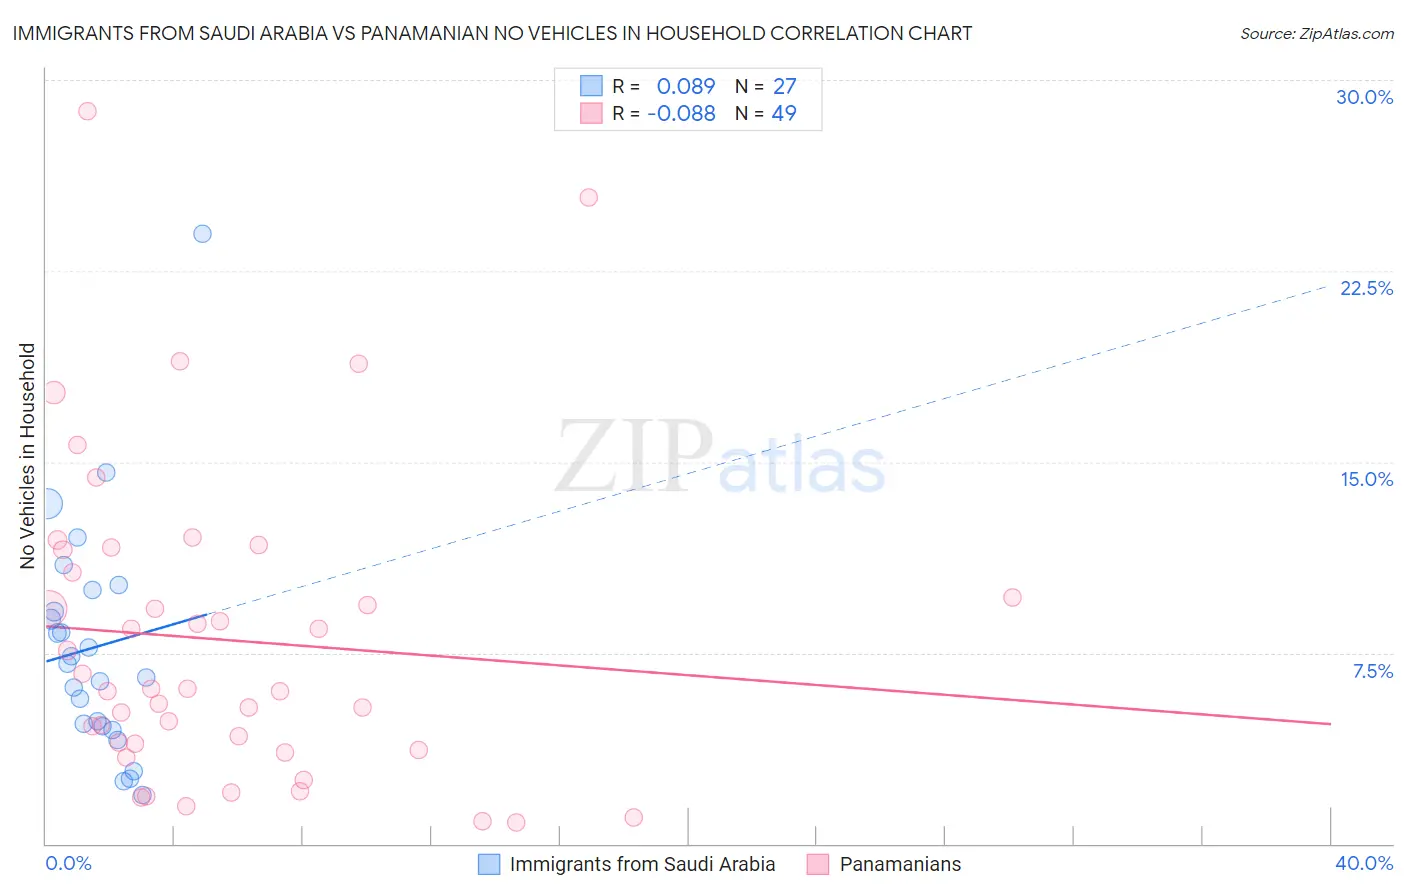
Immigrants from Saudi Arabia vs Panamanian No Vehicles in Household Correlation Chart
The statistical analysis conducted on geographies consisting of 164,171,346 people shows a slight positive correlation between the proportion of Immigrants from Saudi Arabia and percentage of households with no vehicle available in the United States with a correlation coefficient (R) of 0.089 and weighted average of 10.3%. Similarly, the statistical analysis conducted on geographies consisting of 280,874,828 people shows a slight negative correlation between the proportion of Panamanians and percentage of households with no vehicle available in the United States with a correlation coefficient (R) of -0.088 and weighted average of 12.5%, a difference of 21.9%.
No Vehicles in Household Correlation Summary
| Measurement | Immigrants from Saudi Arabia | Panamanian |
| Minimum | 1.9% | 0.82% |
| Maximum | 24.0% | 28.8% |
| Range | 22.0% | 27.9% |
| Mean | 7.7% | 8.0% |
| Median | 7.1% | 6.1% |
| Interquartile 25% (IQ1) | 4.6% | 3.8% |
| Interquartile 75% (IQ3) | 10.0% | 11.1% |
| Interquartile Range (IQR) | 5.4% | 7.3% |
| Standard Deviation (Sample) | 4.6% | 6.1% |
| Standard Deviation (Population) | 4.6% | 6.1% |
Similar Demographics by No Vehicles in Household
Demographics Similar to Immigrants from Saudi Arabia by No Vehicles in Household
In terms of no vehicles in household, the demographic groups most similar to Immigrants from Saudi Arabia are Immigrants from Costa Rica (10.3%, a difference of 0.24%), Indonesian (10.3%, a difference of 0.29%), Comanche (10.2%, a difference of 0.30%), South African (10.2%, a difference of 0.34%), and Lumbee (10.3%, a difference of 0.56%).
| Demographics | Rating | Rank | No Vehicles in Household |
| Immigrants | Middle Africa | 65.7 /100 | #160 | Good 10.2% |
| New Zealanders | 65.1 /100 | #161 | Good 10.2% |
| Immigrants | Austria | 64.4 /100 | #162 | Good 10.2% |
| Immigrants | Cambodia | 63.7 /100 | #163 | Good 10.2% |
| South Africans | 61.1 /100 | #164 | Good 10.2% |
| Comanche | 60.8 /100 | #165 | Good 10.2% |
| Immigrants | Costa Rica | 60.5 /100 | #166 | Good 10.3% |
| Immigrants | Saudi Arabia | 58.8 /100 | #167 | Average 10.3% |
| Indonesians | 56.7 /100 | #168 | Average 10.3% |
| Lumbee | 54.7 /100 | #169 | Average 10.3% |
| Immigrants | Latin America | 53.2 /100 | #170 | Average 10.4% |
| Hmong | 52.7 /100 | #171 | Average 10.4% |
| Brazilians | 51.7 /100 | #172 | Average 10.4% |
| Filipinos | 50.1 /100 | #173 | Average 10.4% |
| Immigrants | Sudan | 50.0 /100 | #174 | Average 10.4% |
Demographics Similar to Panamanians by No Vehicles in Household
In terms of no vehicles in household, the demographic groups most similar to Panamanians are Immigrants from Africa (12.5%, a difference of 0.13%), Immigrants from Europe (12.5%, a difference of 0.18%), Immigrants from Northern Africa (12.6%, a difference of 0.55%), Immigrants from Morocco (12.6%, a difference of 0.67%), and Israeli (12.4%, a difference of 0.76%).
| Demographics | Rating | Rank | No Vehicles in Household |
| Immigrants | Liberia | 0.6 /100 | #262 | Tragic 12.2% |
| Immigrants | Egypt | 0.6 /100 | #263 | Tragic 12.2% |
| Immigrants | Switzerland | 0.5 /100 | #264 | Tragic 12.3% |
| Africans | 0.4 /100 | #265 | Tragic 12.3% |
| Israelis | 0.3 /100 | #266 | Tragic 12.4% |
| Immigrants | Europe | 0.3 /100 | #267 | Tragic 12.5% |
| Immigrants | Africa | 0.2 /100 | #268 | Tragic 12.5% |
| Panamanians | 0.2 /100 | #269 | Tragic 12.5% |
| Immigrants | Northern Africa | 0.2 /100 | #270 | Tragic 12.6% |
| Immigrants | Morocco | 0.2 /100 | #271 | Tragic 12.6% |
| Bermudans | 0.1 /100 | #272 | Tragic 12.8% |
| Immigrants | France | 0.1 /100 | #273 | Tragic 12.9% |
| Immigrants | Singapore | 0.1 /100 | #274 | Tragic 12.9% |
| Immigrants | Albania | 0.1 /100 | #275 | Tragic 13.0% |
| Immigrants | Southern Europe | 0.1 /100 | #276 | Tragic 13.0% |