Central American vs Immigrants from El Salvador No Vehicles in Household
COMPARE
Central American
Immigrants from El Salvador
No Vehicles in Household
No Vehicles in Household Comparison
Central Americans
Immigrants from El Salvador
10.8%
NO VEHICLES IN HOUSEHOLD
24.3/ 100
METRIC RATING
196th/ 347
METRIC RANK
10.4%
NO VEHICLES IN HOUSEHOLD
49.1/ 100
METRIC RATING
177th/ 347
METRIC RANK
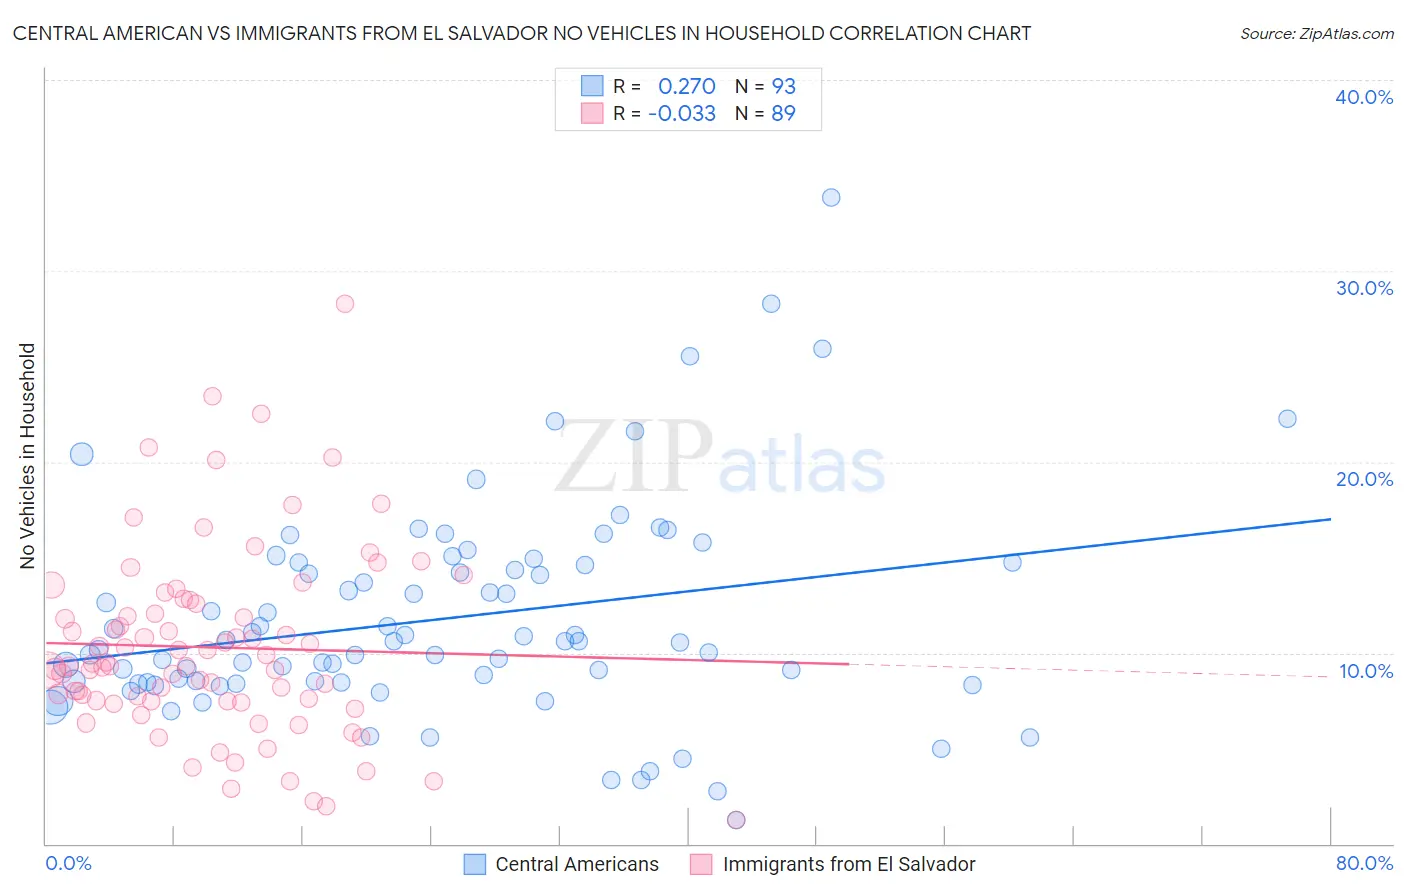
Central American vs Immigrants from El Salvador No Vehicles in Household Correlation Chart
The statistical analysis conducted on geographies consisting of 502,389,156 people shows a weak positive correlation between the proportion of Central Americans and percentage of households with no vehicle available in the United States with a correlation coefficient (R) of 0.270 and weighted average of 10.8%. Similarly, the statistical analysis conducted on geographies consisting of 357,255,745 people shows no correlation between the proportion of Immigrants from El Salvador and percentage of households with no vehicle available in the United States with a correlation coefficient (R) of -0.033 and weighted average of 10.4%, a difference of 3.7%.
No Vehicles in Household Correlation Summary
| Measurement | Central American | Immigrants from El Salvador |
| Minimum | 1.3% | 1.3% |
| Maximum | 33.8% | 28.3% |
| Range | 32.6% | 27.0% |
| Mean | 11.8% | 10.3% |
| Median | 10.6% | 9.3% |
| Interquartile 25% (IQ1) | 8.4% | 7.4% |
| Interquartile 75% (IQ3) | 14.7% | 12.7% |
| Interquartile Range (IQR) | 6.2% | 5.2% |
| Standard Deviation (Sample) | 5.5% | 4.9% |
| Standard Deviation (Population) | 5.5% | 4.9% |
Demographics Similar to Central Americans and Immigrants from El Salvador by No Vehicles in Household
In terms of no vehicles in household, the demographic groups most similar to Central Americans are Immigrants from Brazil (10.8%, a difference of 0.34%), Pueblo (10.8%, a difference of 0.45%), Ukrainian (10.7%, a difference of 0.63%), Carpatho Rusyn (10.7%, a difference of 1.3%), and Immigrants from Northern Europe (10.7%, a difference of 1.4%). Similarly, the demographic groups most similar to Immigrants from El Salvador are French American Indian (10.4%, a difference of 0.010%), Immigrants from Ethiopia (10.4%, a difference of 0.15%), Ethiopian (10.5%, a difference of 0.45%), Arab (10.5%, a difference of 0.51%), and Immigrants from Colombia (10.5%, a difference of 0.67%).
| Demographics | Rating | Rank | No Vehicles in Household |
| French American Indians | 49.1 /100 | #176 | Average 10.4% |
| Immigrants | El Salvador | 49.1 /100 | #177 | Average 10.4% |
| Immigrants | Ethiopia | 48.0 /100 | #178 | Average 10.4% |
| Ethiopians | 45.8 /100 | #179 | Average 10.5% |
| Arabs | 45.3 /100 | #180 | Average 10.5% |
| Immigrants | Colombia | 44.1 /100 | #181 | Average 10.5% |
| Immigrants | Bulgaria | 43.8 /100 | #182 | Average 10.5% |
| Natives/Alaskans | 43.7 /100 | #183 | Average 10.5% |
| Immigrants | Nepal | 42.4 /100 | #184 | Average 10.5% |
| South Americans | 41.9 /100 | #185 | Average 10.5% |
| German Russians | 40.6 /100 | #186 | Average 10.5% |
| Immigrants | Poland | 38.4 /100 | #187 | Fair 10.6% |
| Immigrants | Armenia | 37.5 /100 | #188 | Fair 10.6% |
| Immigrants | Eritrea | 36.3 /100 | #189 | Fair 10.6% |
| Immigrants | North Macedonia | 34.6 /100 | #190 | Fair 10.6% |
| Immigrants | Northern Europe | 33.1 /100 | #191 | Fair 10.7% |
| Carpatho Rusyns | 32.1 /100 | #192 | Fair 10.7% |
| Ukrainians | 28.0 /100 | #193 | Fair 10.7% |
| Pueblo | 27.0 /100 | #194 | Fair 10.8% |
| Immigrants | Brazil | 26.3 /100 | #195 | Fair 10.8% |
| Central Americans | 24.3 /100 | #196 | Fair 10.8% |