Russian vs Immigrants from Mexico 4 or more Vehicles in Household
COMPARE
Russian
Immigrants from Mexico
4 or more Vehicles in Household
4 or more Vehicles in Household Comparison
Russians
Immigrants from Mexico
6.0%
4 OR MORE VEHICLES IN HOUSEHOLD
10.3/ 100
METRIC RATING
220th/ 347
METRIC RANK
9.0%
4 OR MORE VEHICLES IN HOUSEHOLD
100.0/ 100
METRIC RATING
11th/ 347
METRIC RANK
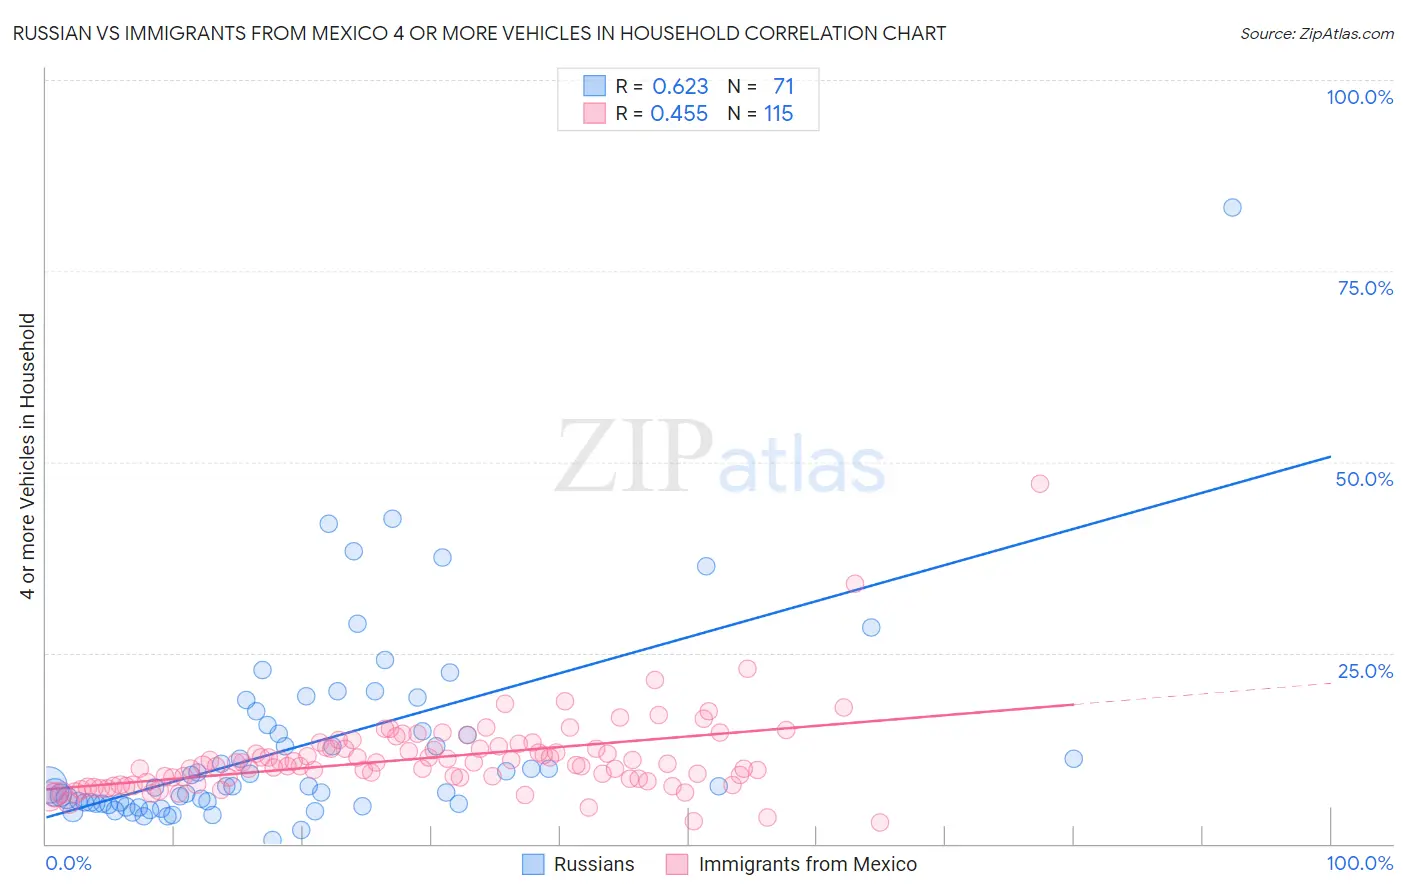
Russian vs Immigrants from Mexico 4 or more Vehicles in Household Correlation Chart
The statistical analysis conducted on geographies consisting of 509,368,397 people shows a significant positive correlation between the proportion of Russians and percentage of households with 4 or more vehicles available in the United States with a correlation coefficient (R) of 0.623 and weighted average of 6.0%. Similarly, the statistical analysis conducted on geographies consisting of 511,223,450 people shows a moderate positive correlation between the proportion of Immigrants from Mexico and percentage of households with 4 or more vehicles available in the United States with a correlation coefficient (R) of 0.455 and weighted average of 9.0%, a difference of 50.5%.
4 or more Vehicles in Household Correlation Summary
| Measurement | Russian | Immigrants from Mexico |
| Minimum | 0.51% | 2.8% |
| Maximum | 83.3% | 47.1% |
| Range | 82.8% | 44.3% |
| Mean | 12.8% | 11.2% |
| Median | 7.5% | 10.3% |
| Interquartile 25% (IQ1) | 5.3% | 8.1% |
| Interquartile 75% (IQ3) | 15.6% | 12.5% |
| Interquartile Range (IQR) | 10.3% | 4.4% |
| Standard Deviation (Sample) | 13.0% | 5.4% |
| Standard Deviation (Population) | 12.9% | 5.3% |
Similar Demographics by 4 or more Vehicles in Household
Demographics Similar to Russians by 4 or more Vehicles in Household
In terms of 4 or more vehicles in household, the demographic groups most similar to Russians are Immigrants from Italy (6.0%, a difference of 0.19%), Serbian (6.0%, a difference of 0.19%), Immigrants from Moldova (6.0%, a difference of 0.29%), Cajun (6.0%, a difference of 0.33%), and Immigrants from Kenya (6.0%, a difference of 0.33%).
| Demographics | Rating | Rank | 4 or more Vehicles in Household |
| Arabs | 14.4 /100 | #213 | Poor 6.0% |
| Immigrants | Austria | 14.3 /100 | #214 | Poor 6.0% |
| Immigrants | China | 13.8 /100 | #215 | Poor 6.0% |
| Immigrants | Romania | 13.8 /100 | #216 | Poor 6.0% |
| Nigerians | 12.2 /100 | #217 | Poor 6.0% |
| Immigrants | Italy | 11.0 /100 | #218 | Poor 6.0% |
| Serbians | 11.0 /100 | #219 | Poor 6.0% |
| Russians | 10.3 /100 | #220 | Poor 6.0% |
| Immigrants | Moldova | 9.3 /100 | #221 | Tragic 6.0% |
| Cajuns | 9.2 /100 | #222 | Tragic 6.0% |
| Immigrants | Kenya | 9.2 /100 | #223 | Tragic 6.0% |
| Cubans | 9.2 /100 | #224 | Tragic 6.0% |
| Indonesians | 8.9 /100 | #225 | Tragic 6.0% |
| Immigrants | Singapore | 7.9 /100 | #226 | Tragic 5.9% |
| Immigrants | Western Asia | 7.8 /100 | #227 | Tragic 5.9% |
Demographics Similar to Immigrants from Mexico by 4 or more Vehicles in Household
In terms of 4 or more vehicles in household, the demographic groups most similar to Immigrants from Mexico are Paiute (9.0%, a difference of 0.12%), Mexican (8.9%, a difference of 0.68%), Hawaiian (8.9%, a difference of 0.69%), Chinese (8.8%, a difference of 1.7%), and Shoshone (8.8%, a difference of 1.7%).
| Demographics | Rating | Rank | 4 or more Vehicles in Household |
| Tongans | 100.0 /100 | #4 | Exceptional 10.0% |
| Immigrants | Fiji | 100.0 /100 | #5 | Exceptional 9.6% |
| Puget Sound Salish | 100.0 /100 | #6 | Exceptional 9.4% |
| Native Hawaiians | 100.0 /100 | #7 | Exceptional 9.4% |
| Arapaho | 100.0 /100 | #8 | Exceptional 9.4% |
| Samoans | 100.0 /100 | #9 | Exceptional 9.2% |
| Paiute | 100.0 /100 | #10 | Exceptional 9.0% |
| Immigrants | Mexico | 100.0 /100 | #11 | Exceptional 9.0% |
| Mexicans | 100.0 /100 | #12 | Exceptional 8.9% |
| Hawaiians | 100.0 /100 | #13 | Exceptional 8.9% |
| Chinese | 100.0 /100 | #14 | Exceptional 8.8% |
| Shoshone | 100.0 /100 | #15 | Exceptional 8.8% |
| Lumbee | 100.0 /100 | #16 | Exceptional 8.8% |
| Ute | 100.0 /100 | #17 | Exceptional 8.8% |
| Nepalese | 100.0 /100 | #18 | Exceptional 8.7% |