Russian vs Chickasaw 4 or more Vehicles in Household
COMPARE
Russian
Chickasaw
4 or more Vehicles in Household
4 or more Vehicles in Household Comparison
Russians
Chickasaw
6.0%
4 OR MORE VEHICLES IN HOUSEHOLD
10.3/ 100
METRIC RATING
220th/ 347
METRIC RANK
7.4%
4 OR MORE VEHICLES IN HOUSEHOLD
99.9/ 100
METRIC RATING
71st/ 347
METRIC RANK
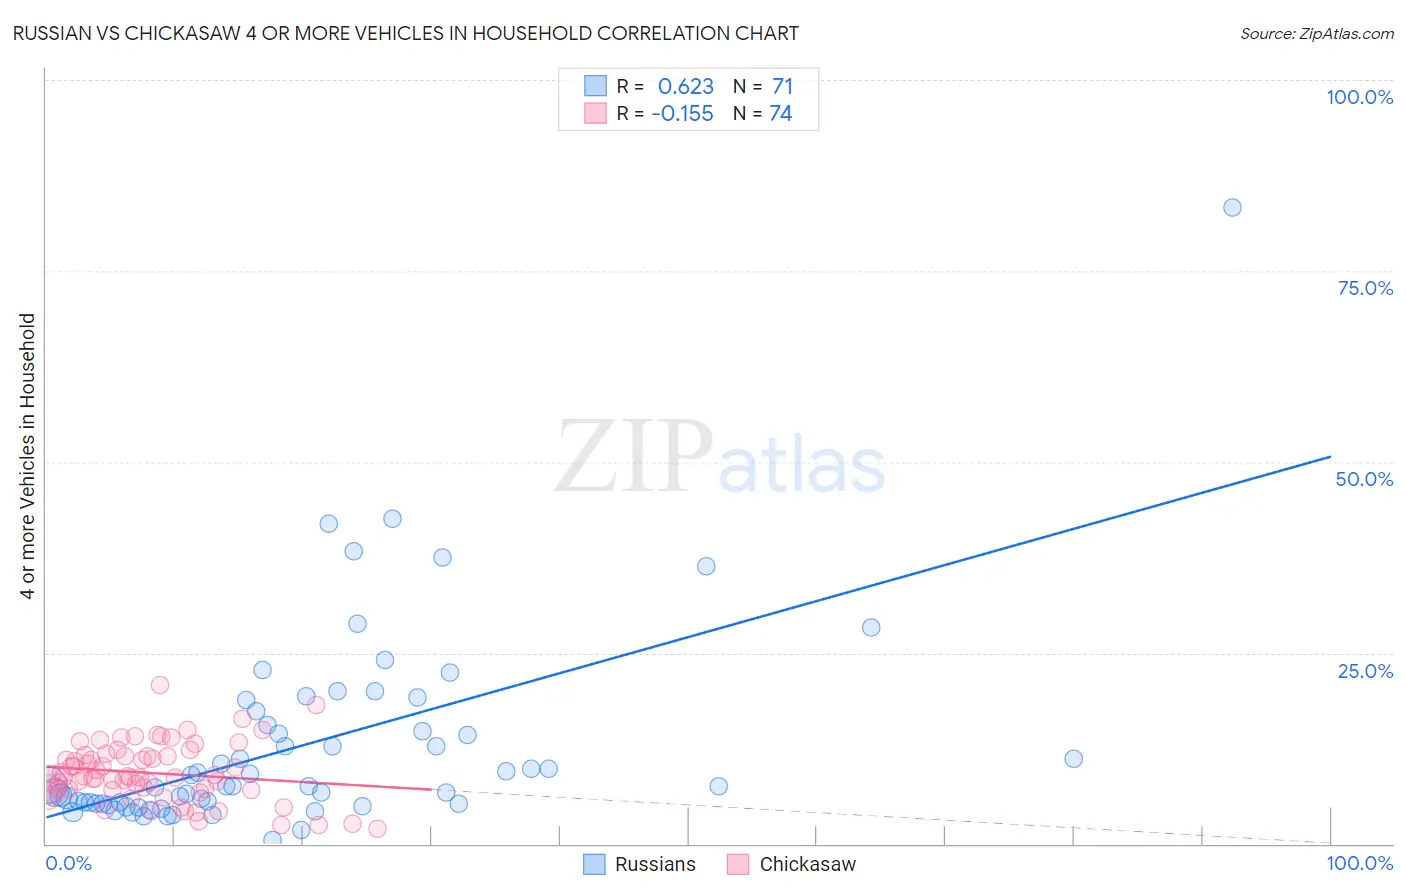
Russian vs Chickasaw 4 or more Vehicles in Household Correlation Chart
The statistical analysis conducted on geographies consisting of 509,368,397 people shows a significant positive correlation between the proportion of Russians and percentage of households with 4 or more vehicles available in the United States with a correlation coefficient (R) of 0.623 and weighted average of 6.0%. Similarly, the statistical analysis conducted on geographies consisting of 147,524,339 people shows a poor negative correlation between the proportion of Chickasaw and percentage of households with 4 or more vehicles available in the United States with a correlation coefficient (R) of -0.155 and weighted average of 7.4%, a difference of 24.4%.
4 or more Vehicles in Household Correlation Summary
| Measurement | Russian | Chickasaw |
| Minimum | 0.51% | 2.0% |
| Maximum | 83.3% | 20.8% |
| Range | 82.8% | 18.8% |
| Mean | 12.8% | 9.3% |
| Median | 7.5% | 8.8% |
| Interquartile 25% (IQ1) | 5.3% | 7.0% |
| Interquartile 75% (IQ3) | 15.6% | 11.5% |
| Interquartile Range (IQR) | 10.3% | 4.5% |
| Standard Deviation (Sample) | 13.0% | 3.8% |
| Standard Deviation (Population) | 12.9% | 3.8% |
Similar Demographics by 4 or more Vehicles in Household
Demographics Similar to Russians by 4 or more Vehicles in Household
In terms of 4 or more vehicles in household, the demographic groups most similar to Russians are Immigrants from Italy (6.0%, a difference of 0.19%), Serbian (6.0%, a difference of 0.19%), Immigrants from Moldova (6.0%, a difference of 0.29%), Cajun (6.0%, a difference of 0.33%), and Immigrants from Kenya (6.0%, a difference of 0.33%).
| Demographics | Rating | Rank | 4 or more Vehicles in Household |
| Arabs | 14.4 /100 | #213 | Poor 6.0% |
| Immigrants | Austria | 14.3 /100 | #214 | Poor 6.0% |
| Immigrants | China | 13.8 /100 | #215 | Poor 6.0% |
| Immigrants | Romania | 13.8 /100 | #216 | Poor 6.0% |
| Nigerians | 12.2 /100 | #217 | Poor 6.0% |
| Immigrants | Italy | 11.0 /100 | #218 | Poor 6.0% |
| Serbians | 11.0 /100 | #219 | Poor 6.0% |
| Russians | 10.3 /100 | #220 | Poor 6.0% |
| Immigrants | Moldova | 9.3 /100 | #221 | Tragic 6.0% |
| Cajuns | 9.2 /100 | #222 | Tragic 6.0% |
| Immigrants | Kenya | 9.2 /100 | #223 | Tragic 6.0% |
| Cubans | 9.2 /100 | #224 | Tragic 6.0% |
| Indonesians | 8.9 /100 | #225 | Tragic 6.0% |
| Immigrants | Singapore | 7.9 /100 | #226 | Tragic 5.9% |
| Immigrants | Western Asia | 7.8 /100 | #227 | Tragic 5.9% |
Demographics Similar to Chickasaw by 4 or more Vehicles in Household
In terms of 4 or more vehicles in household, the demographic groups most similar to Chickasaw are Scottish (7.4%, a difference of 0.13%), German (7.5%, a difference of 0.20%), Scotch-Irish (7.4%, a difference of 0.30%), Portuguese (7.4%, a difference of 0.39%), and Icelander (7.4%, a difference of 0.69%).
| Demographics | Rating | Rank | 4 or more Vehicles in Household |
| Bangladeshis | 100.0 /100 | #64 | Exceptional 7.6% |
| Immigrants | Azores | 100.0 /100 | #65 | Exceptional 7.5% |
| Immigrants | Taiwan | 99.9 /100 | #66 | Exceptional 7.5% |
| Americans | 99.9 /100 | #67 | Exceptional 7.5% |
| Welsh | 99.9 /100 | #68 | Exceptional 7.5% |
| Germans | 99.9 /100 | #69 | Exceptional 7.5% |
| Scottish | 99.9 /100 | #70 | Exceptional 7.4% |
| Chickasaw | 99.9 /100 | #71 | Exceptional 7.4% |
| Scotch-Irish | 99.9 /100 | #72 | Exceptional 7.4% |
| Portuguese | 99.9 /100 | #73 | Exceptional 7.4% |
| Icelanders | 99.9 /100 | #74 | Exceptional 7.4% |
| Immigrants | Cambodia | 99.9 /100 | #75 | Exceptional 7.4% |
| Laotians | 99.9 /100 | #76 | Exceptional 7.4% |
| Apache | 99.9 /100 | #77 | Exceptional 7.4% |
| Whites/Caucasians | 99.8 /100 | #78 | Exceptional 7.4% |