Immigrants from Lithuania vs Chickasaw 4 or more Vehicles in Household
COMPARE
Immigrants from Lithuania
Chickasaw
4 or more Vehicles in Household
4 or more Vehicles in Household Comparison
Immigrants from Lithuania
Chickasaw
5.6%
4 OR MORE VEHICLES IN HOUSEHOLD
1.4/ 100
METRIC RATING
258th/ 347
METRIC RANK
7.4%
4 OR MORE VEHICLES IN HOUSEHOLD
99.9/ 100
METRIC RATING
71st/ 347
METRIC RANK
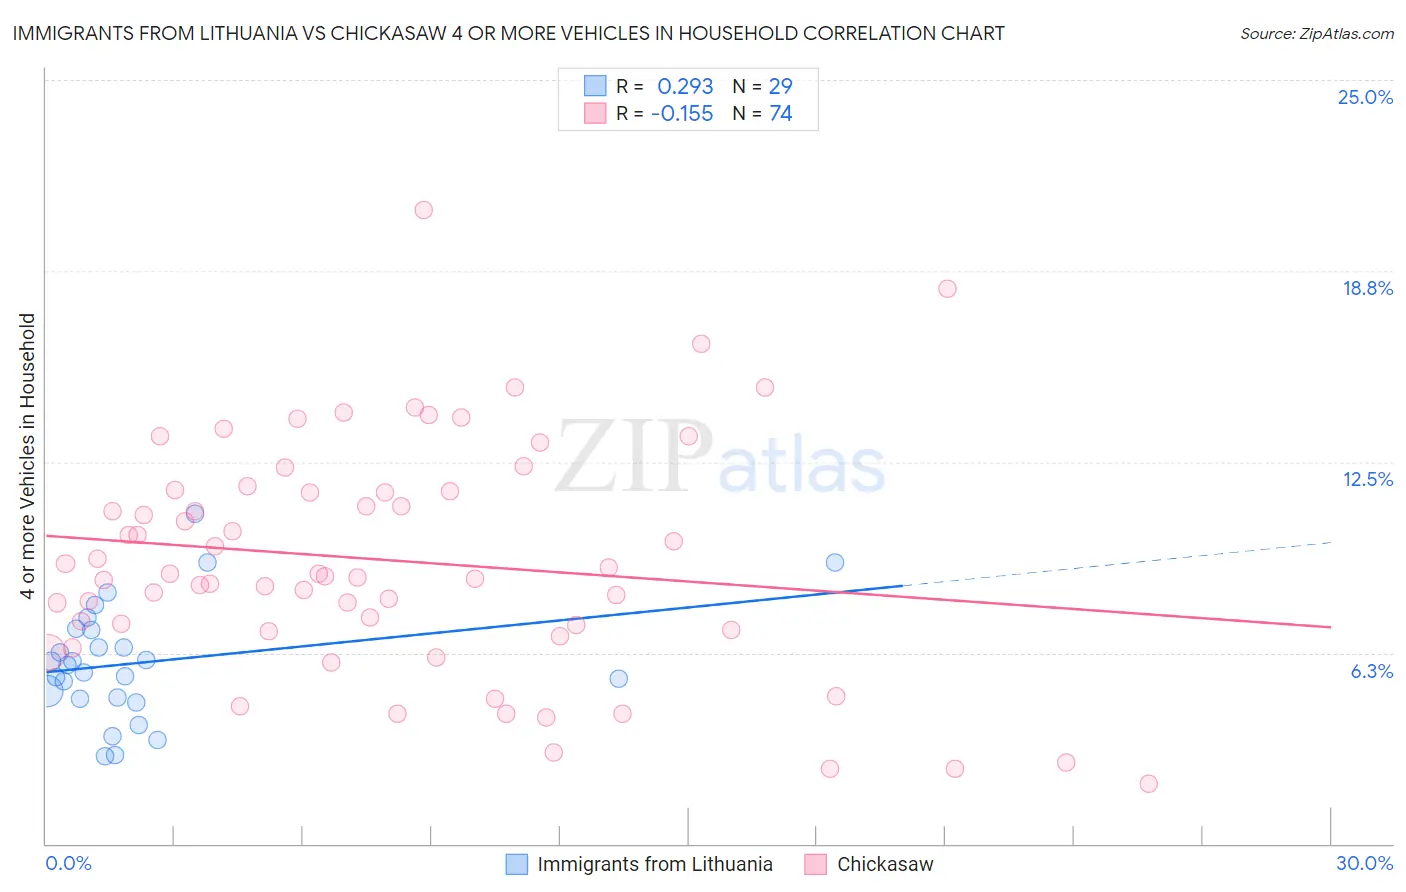
Immigrants from Lithuania vs Chickasaw 4 or more Vehicles in Household Correlation Chart
The statistical analysis conducted on geographies consisting of 117,416,675 people shows a weak positive correlation between the proportion of Immigrants from Lithuania and percentage of households with 4 or more vehicles available in the United States with a correlation coefficient (R) of 0.293 and weighted average of 5.6%. Similarly, the statistical analysis conducted on geographies consisting of 147,524,339 people shows a poor negative correlation between the proportion of Chickasaw and percentage of households with 4 or more vehicles available in the United States with a correlation coefficient (R) of -0.155 and weighted average of 7.4%, a difference of 31.8%.
4 or more Vehicles in Household Correlation Summary
| Measurement | Immigrants from Lithuania | Chickasaw |
| Minimum | 2.9% | 2.0% |
| Maximum | 10.8% | 20.8% |
| Range | 7.9% | 18.8% |
| Mean | 6.0% | 9.3% |
| Median | 5.8% | 8.8% |
| Interquartile 25% (IQ1) | 4.8% | 7.0% |
| Interquartile 75% (IQ3) | 7.0% | 11.5% |
| Interquartile Range (IQR) | 2.2% | 4.5% |
| Standard Deviation (Sample) | 1.9% | 3.8% |
| Standard Deviation (Population) | 1.9% | 3.8% |
Similar Demographics by 4 or more Vehicles in Household
Demographics Similar to Immigrants from Lithuania by 4 or more Vehicles in Household
In terms of 4 or more vehicles in household, the demographic groups most similar to Immigrants from Lithuania are Immigrants from France (5.6%, a difference of 0.030%), Immigrants from Northern Africa (5.6%, a difference of 0.14%), Immigrants from Turkey (5.7%, a difference of 0.22%), Uruguayan (5.6%, a difference of 0.22%), and Yup'ik (5.7%, a difference of 0.25%).
| Demographics | Rating | Rank | 4 or more Vehicles in Household |
| Ugandans | 2.2 /100 | #251 | Tragic 5.7% |
| Sub-Saharan Africans | 2.1 /100 | #252 | Tragic 5.7% |
| Immigrants | Cuba | 1.6 /100 | #253 | Tragic 5.7% |
| Immigrants | Panama | 1.5 /100 | #254 | Tragic 5.7% |
| Yup'ik | 1.5 /100 | #255 | Tragic 5.7% |
| Immigrants | Turkey | 1.5 /100 | #256 | Tragic 5.7% |
| Immigrants | Northern Africa | 1.4 /100 | #257 | Tragic 5.6% |
| Immigrants | Lithuania | 1.4 /100 | #258 | Tragic 5.6% |
| Immigrants | France | 1.3 /100 | #259 | Tragic 5.6% |
| Uruguayans | 1.3 /100 | #260 | Tragic 5.6% |
| Sudanese | 1.2 /100 | #261 | Tragic 5.6% |
| Bermudans | 1.2 /100 | #262 | Tragic 5.6% |
| Immigrants | Saudi Arabia | 1.1 /100 | #263 | Tragic 5.6% |
| Immigrants | Africa | 1.0 /100 | #264 | Tragic 5.6% |
| South Americans | 0.9 /100 | #265 | Tragic 5.6% |
Demographics Similar to Chickasaw by 4 or more Vehicles in Household
In terms of 4 or more vehicles in household, the demographic groups most similar to Chickasaw are Scottish (7.4%, a difference of 0.13%), German (7.5%, a difference of 0.20%), Scotch-Irish (7.4%, a difference of 0.30%), Portuguese (7.4%, a difference of 0.39%), and Icelander (7.4%, a difference of 0.69%).
| Demographics | Rating | Rank | 4 or more Vehicles in Household |
| Bangladeshis | 100.0 /100 | #64 | Exceptional 7.6% |
| Immigrants | Azores | 100.0 /100 | #65 | Exceptional 7.5% |
| Immigrants | Taiwan | 99.9 /100 | #66 | Exceptional 7.5% |
| Americans | 99.9 /100 | #67 | Exceptional 7.5% |
| Welsh | 99.9 /100 | #68 | Exceptional 7.5% |
| Germans | 99.9 /100 | #69 | Exceptional 7.5% |
| Scottish | 99.9 /100 | #70 | Exceptional 7.4% |
| Chickasaw | 99.9 /100 | #71 | Exceptional 7.4% |
| Scotch-Irish | 99.9 /100 | #72 | Exceptional 7.4% |
| Portuguese | 99.9 /100 | #73 | Exceptional 7.4% |
| Icelanders | 99.9 /100 | #74 | Exceptional 7.4% |
| Immigrants | Cambodia | 99.9 /100 | #75 | Exceptional 7.4% |
| Laotians | 99.9 /100 | #76 | Exceptional 7.4% |
| Apache | 99.9 /100 | #77 | Exceptional 7.4% |
| Whites/Caucasians | 99.8 /100 | #78 | Exceptional 7.4% |