Polish vs Colville 1 or more Vehicles in Household
COMPARE
Polish
Colville
1 or more Vehicles in Household
1 or more Vehicles in Household Comparison
Poles
Colville
91.7%
1 OR MORE VEHICLES IN HOUSEHOLD
99.7/ 100
METRIC RATING
71st/ 347
METRIC RANK
86.8%
1 OR MORE VEHICLES IN HOUSEHOLD
0.0/ 100
METRIC RATING
282nd/ 347
METRIC RANK
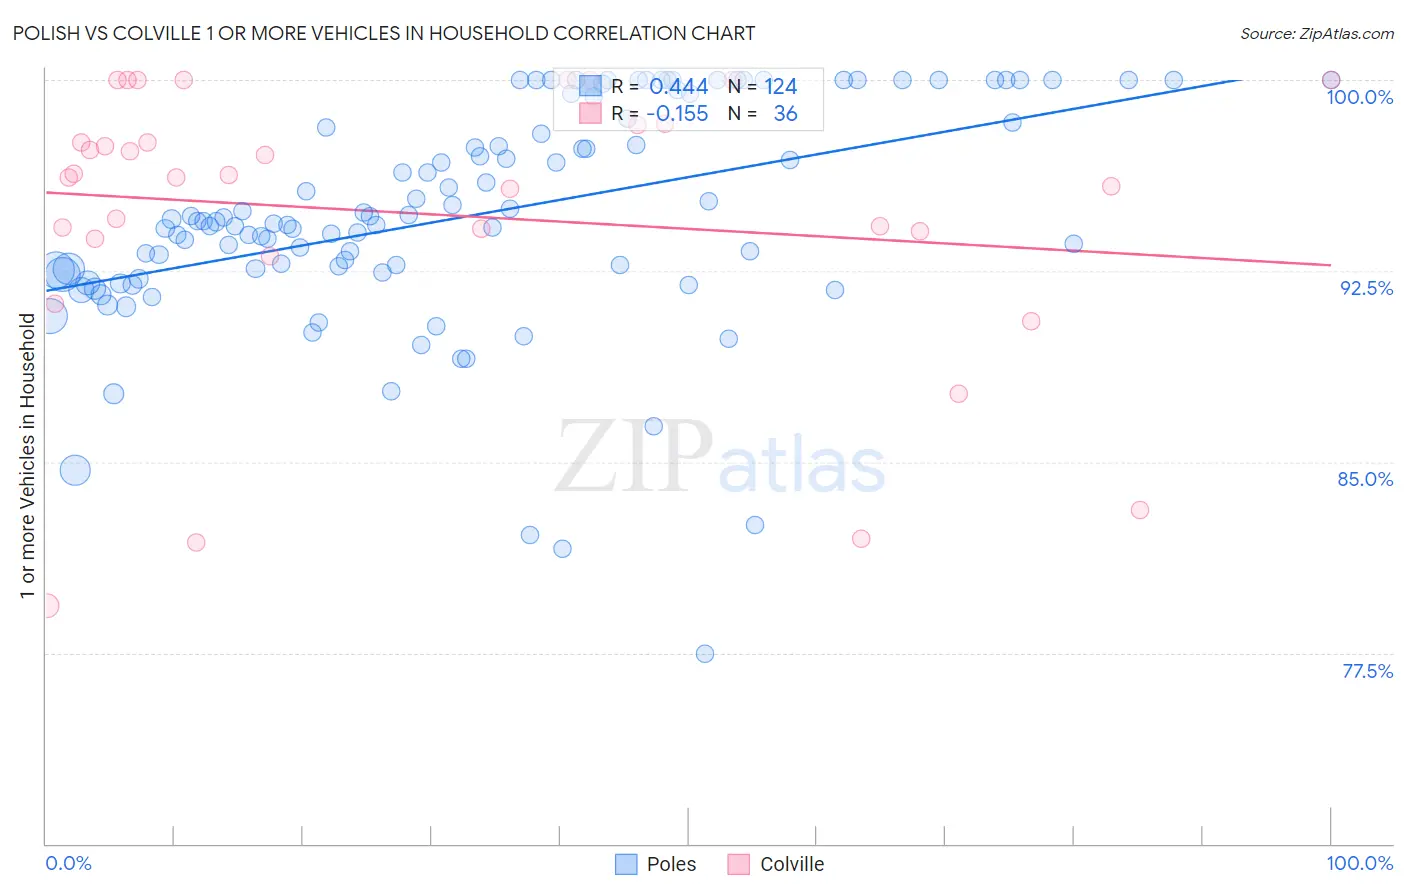
Polish vs Colville 1 or more Vehicles in Household Correlation Chart
The statistical analysis conducted on geographies consisting of 560,073,045 people shows a moderate positive correlation between the proportion of Poles and percentage of households with 1 or more vehicles available in the United States with a correlation coefficient (R) of 0.444 and weighted average of 91.7%. Similarly, the statistical analysis conducted on geographies consisting of 34,683,110 people shows a poor negative correlation between the proportion of Colville and percentage of households with 1 or more vehicles available in the United States with a correlation coefficient (R) of -0.155 and weighted average of 86.8%, a difference of 5.7%.
1 or more Vehicles in Household Correlation Summary
| Measurement | Polish | Colville |
| Minimum | 77.5% | 79.3% |
| Maximum | 100.0% | 100.0% |
| Range | 22.5% | 20.7% |
| Mean | 94.7% | 94.7% |
| Median | 94.4% | 96.2% |
| Interquartile 25% (IQ1) | 92.5% | 93.9% |
| Interquartile 75% (IQ3) | 98.4% | 98.3% |
| Interquartile Range (IQR) | 5.9% | 4.3% |
| Standard Deviation (Sample) | 4.4% | 5.6% |
| Standard Deviation (Population) | 4.4% | 5.5% |
Similar Demographics by 1 or more Vehicles in Household
Demographics Similar to Poles by 1 or more Vehicles in Household
In terms of 1 or more vehicles in household, the demographic groups most similar to Poles are Cajun (91.7%, a difference of 0.0%), Immigrants from Iran (91.7%, a difference of 0.010%), Lithuanian (91.7%, a difference of 0.020%), Palestinian (91.7%, a difference of 0.040%), and Immigrants from Lebanon (91.6%, a difference of 0.050%).
| Demographics | Rating | Rank | 1 or more Vehicles in Household |
| Croatians | 99.8 /100 | #64 | Exceptional 91.9% |
| Immigrants | Laos | 99.8 /100 | #65 | Exceptional 91.8% |
| Canadians | 99.8 /100 | #66 | Exceptional 91.8% |
| Spaniards | 99.8 /100 | #67 | Exceptional 91.8% |
| Immigrants | Scotland | 99.7 /100 | #68 | Exceptional 91.8% |
| Palestinians | 99.7 /100 | #69 | Exceptional 91.7% |
| Lithuanians | 99.7 /100 | #70 | Exceptional 91.7% |
| Poles | 99.7 /100 | #71 | Exceptional 91.7% |
| Cajuns | 99.7 /100 | #72 | Exceptional 91.7% |
| Immigrants | Iran | 99.7 /100 | #73 | Exceptional 91.7% |
| Immigrants | Lebanon | 99.6 /100 | #74 | Exceptional 91.6% |
| Portuguese | 99.5 /100 | #75 | Exceptional 91.6% |
| Cubans | 99.5 /100 | #76 | Exceptional 91.5% |
| Immigrants | Philippines | 99.4 /100 | #77 | Exceptional 91.5% |
| Iranians | 99.4 /100 | #78 | Exceptional 91.5% |
Demographics Similar to Colville by 1 or more Vehicles in Household
In terms of 1 or more vehicles in household, the demographic groups most similar to Colville are Immigrants from Eastern Europe (86.7%, a difference of 0.040%), Central American Indian (86.7%, a difference of 0.040%), Mongolian (87.0%, a difference of 0.23%), Immigrants from Kazakhstan (86.6%, a difference of 0.24%), and Immigrants from Eastern Asia (86.5%, a difference of 0.27%).
| Demographics | Rating | Rank | 1 or more Vehicles in Household |
| Immigrants | Singapore | 0.1 /100 | #275 | Tragic 87.2% |
| Immigrants | France | 0.1 /100 | #276 | Tragic 87.1% |
| Alsatians | 0.1 /100 | #277 | Tragic 87.1% |
| Immigrants | Southern Europe | 0.1 /100 | #278 | Tragic 87.1% |
| Immigrants | Albania | 0.1 /100 | #279 | Tragic 87.1% |
| Immigrants | Croatia | 0.0 /100 | #280 | Tragic 87.0% |
| Mongolians | 0.0 /100 | #281 | Tragic 87.0% |
| Colville | 0.0 /100 | #282 | Tragic 86.8% |
| Immigrants | Eastern Europe | 0.0 /100 | #283 | Tragic 86.7% |
| Central American Indians | 0.0 /100 | #284 | Tragic 86.7% |
| Immigrants | Kazakhstan | 0.0 /100 | #285 | Tragic 86.6% |
| Immigrants | Eastern Asia | 0.0 /100 | #286 | Tragic 86.5% |
| Immigrants | Malaysia | 0.0 /100 | #287 | Tragic 86.5% |
| Hopi | 0.0 /100 | #288 | Tragic 86.4% |
| Immigrants | Ireland | 0.0 /100 | #289 | Tragic 86.4% |