Central American vs Immigrants from Ecuador No Vehicles in Household
COMPARE
Central American
Immigrants from Ecuador
No Vehicles in Household
No Vehicles in Household Comparison
Central Americans
Immigrants from Ecuador
10.8%
NO VEHICLES IN HOUSEHOLD
24.3/ 100
METRIC RATING
196th/ 347
METRIC RANK
23.8%
NO VEHICLES IN HOUSEHOLD
0.0/ 100
METRIC RATING
332nd/ 347
METRIC RANK
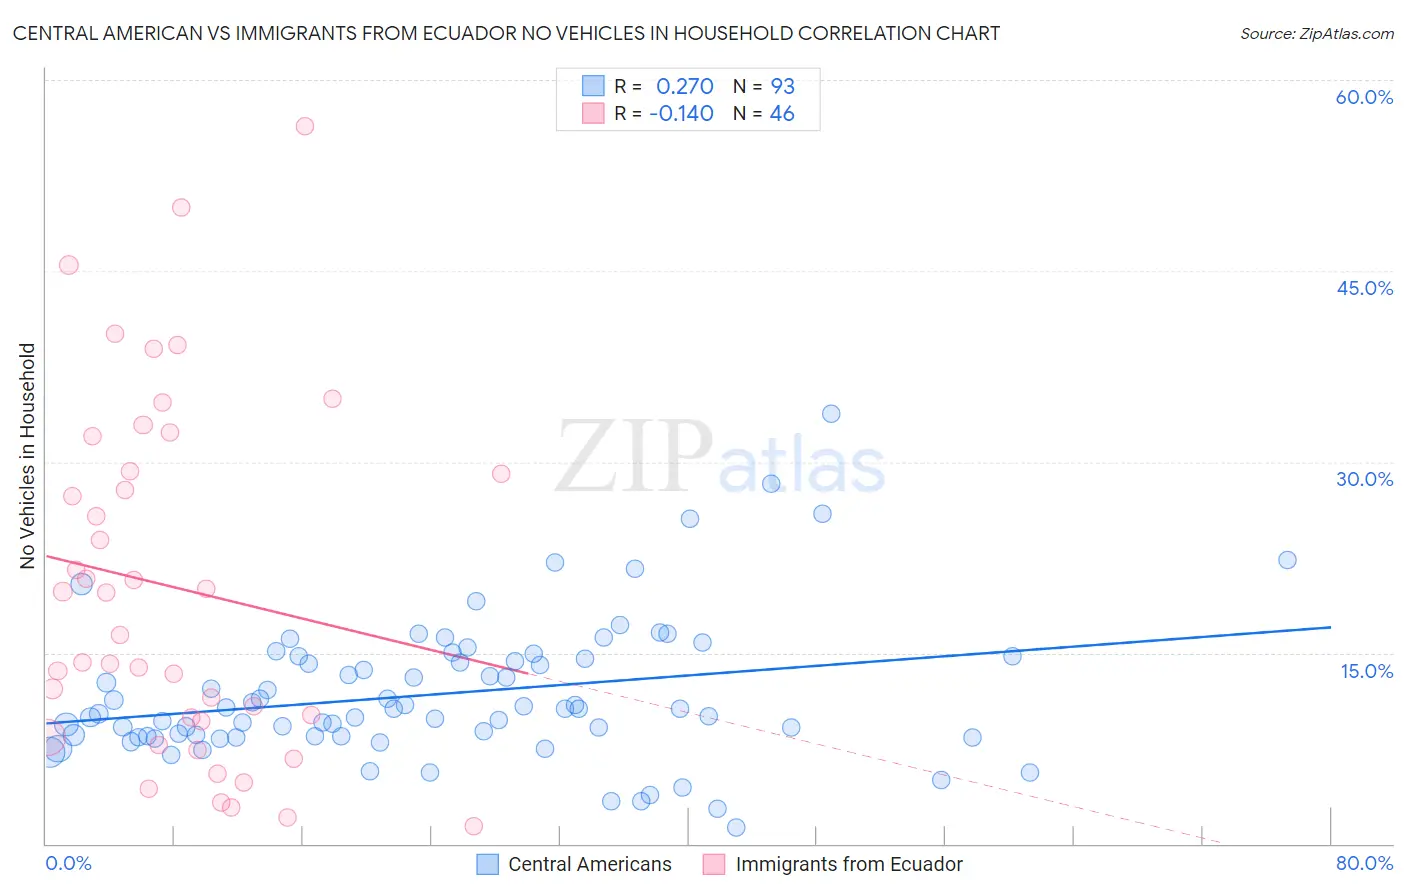
Central American vs Immigrants from Ecuador No Vehicles in Household Correlation Chart
The statistical analysis conducted on geographies consisting of 502,389,156 people shows a weak positive correlation between the proportion of Central Americans and percentage of households with no vehicle available in the United States with a correlation coefficient (R) of 0.270 and weighted average of 10.8%. Similarly, the statistical analysis conducted on geographies consisting of 270,577,361 people shows a poor negative correlation between the proportion of Immigrants from Ecuador and percentage of households with no vehicle available in the United States with a correlation coefficient (R) of -0.140 and weighted average of 23.8%, a difference of 120.6%.
No Vehicles in Household Correlation Summary
| Measurement | Central American | Immigrants from Ecuador |
| Minimum | 1.3% | 1.4% |
| Maximum | 33.8% | 56.4% |
| Range | 32.6% | 54.9% |
| Mean | 11.8% | 20.1% |
| Median | 10.6% | 18.1% |
| Interquartile 25% (IQ1) | 8.4% | 9.6% |
| Interquartile 75% (IQ3) | 14.7% | 29.2% |
| Interquartile Range (IQR) | 6.2% | 19.6% |
| Standard Deviation (Sample) | 5.5% | 13.8% |
| Standard Deviation (Population) | 5.5% | 13.6% |
Similar Demographics by No Vehicles in Household
Demographics Similar to Central Americans by No Vehicles in Household
In terms of no vehicles in household, the demographic groups most similar to Central Americans are Shoshone (10.8%, a difference of 0.040%), Immigrants from Sweden (10.8%, a difference of 0.25%), Immigrants from Brazil (10.8%, a difference of 0.34%), Pueblo (10.8%, a difference of 0.45%), and Immigrants from Asia (10.9%, a difference of 0.56%).
| Demographics | Rating | Rank | No Vehicles in Household |
| Immigrants | Eritrea | 36.3 /100 | #189 | Fair 10.6% |
| Immigrants | North Macedonia | 34.6 /100 | #190 | Fair 10.6% |
| Immigrants | Northern Europe | 33.1 /100 | #191 | Fair 10.7% |
| Carpatho Rusyns | 32.1 /100 | #192 | Fair 10.7% |
| Ukrainians | 28.0 /100 | #193 | Fair 10.7% |
| Pueblo | 27.0 /100 | #194 | Fair 10.8% |
| Immigrants | Brazil | 26.3 /100 | #195 | Fair 10.8% |
| Central Americans | 24.3 /100 | #196 | Fair 10.8% |
| Shoshone | 24.1 /100 | #197 | Fair 10.8% |
| Immigrants | Sweden | 22.9 /100 | #198 | Fair 10.8% |
| Immigrants | Asia | 21.3 /100 | #199 | Fair 10.9% |
| Cambodians | 19.6 /100 | #200 | Poor 10.9% |
| Immigrants | Western Europe | 19.1 /100 | #201 | Poor 10.9% |
| Romanians | 17.9 /100 | #202 | Poor 10.9% |
| Iroquois | 17.6 /100 | #203 | Poor 10.9% |
Demographics Similar to Immigrants from Ecuador by No Vehicles in Household
In terms of no vehicles in household, the demographic groups most similar to Immigrants from Ecuador are Trinidadian and Tobagonian (23.7%, a difference of 0.33%), West Indian (23.7%, a difference of 0.51%), Immigrants from Trinidad and Tobago (24.6%, a difference of 3.4%), Ecuadorian (22.8%, a difference of 4.7%), and Immigrants from Dominica (22.2%, a difference of 7.2%).
| Demographics | Rating | Rank | No Vehicles in Household |
| Senegalese | 0.0 /100 | #325 | Tragic 19.8% |
| Immigrants | West Indies | 0.0 /100 | #326 | Tragic 20.5% |
| Immigrants | Senegal | 0.0 /100 | #327 | Tragic 21.1% |
| Immigrants | Dominica | 0.0 /100 | #328 | Tragic 22.2% |
| Ecuadorians | 0.0 /100 | #329 | Tragic 22.8% |
| West Indians | 0.0 /100 | #330 | Tragic 23.7% |
| Trinidadians and Tobagonians | 0.0 /100 | #331 | Tragic 23.7% |
| Immigrants | Ecuador | 0.0 /100 | #332 | Tragic 23.8% |
| Immigrants | Trinidad and Tobago | 0.0 /100 | #333 | Tragic 24.6% |
| Immigrants | Bangladesh | 0.0 /100 | #334 | Tragic 25.8% |
| Barbadians | 0.0 /100 | #335 | Tragic 26.1% |
| Vietnamese | 0.0 /100 | #336 | Tragic 26.2% |
| Immigrants | Uzbekistan | 0.0 /100 | #337 | Tragic 26.7% |
| Guyanese | 0.0 /100 | #338 | Tragic 29.3% |
| Dominicans | 0.0 /100 | #339 | Tragic 29.4% |