Immigrants from Croatia vs Immigrants from Ecuador No Vehicles in Household
COMPARE
Immigrants from Croatia
Immigrants from Ecuador
No Vehicles in Household
No Vehicles in Household Comparison
Immigrants from Croatia
Immigrants from Ecuador
13.0%
NO VEHICLES IN HOUSEHOLD
0.1/ 100
METRIC RATING
278th/ 347
METRIC RANK
23.8%
NO VEHICLES IN HOUSEHOLD
0.0/ 100
METRIC RATING
332nd/ 347
METRIC RANK
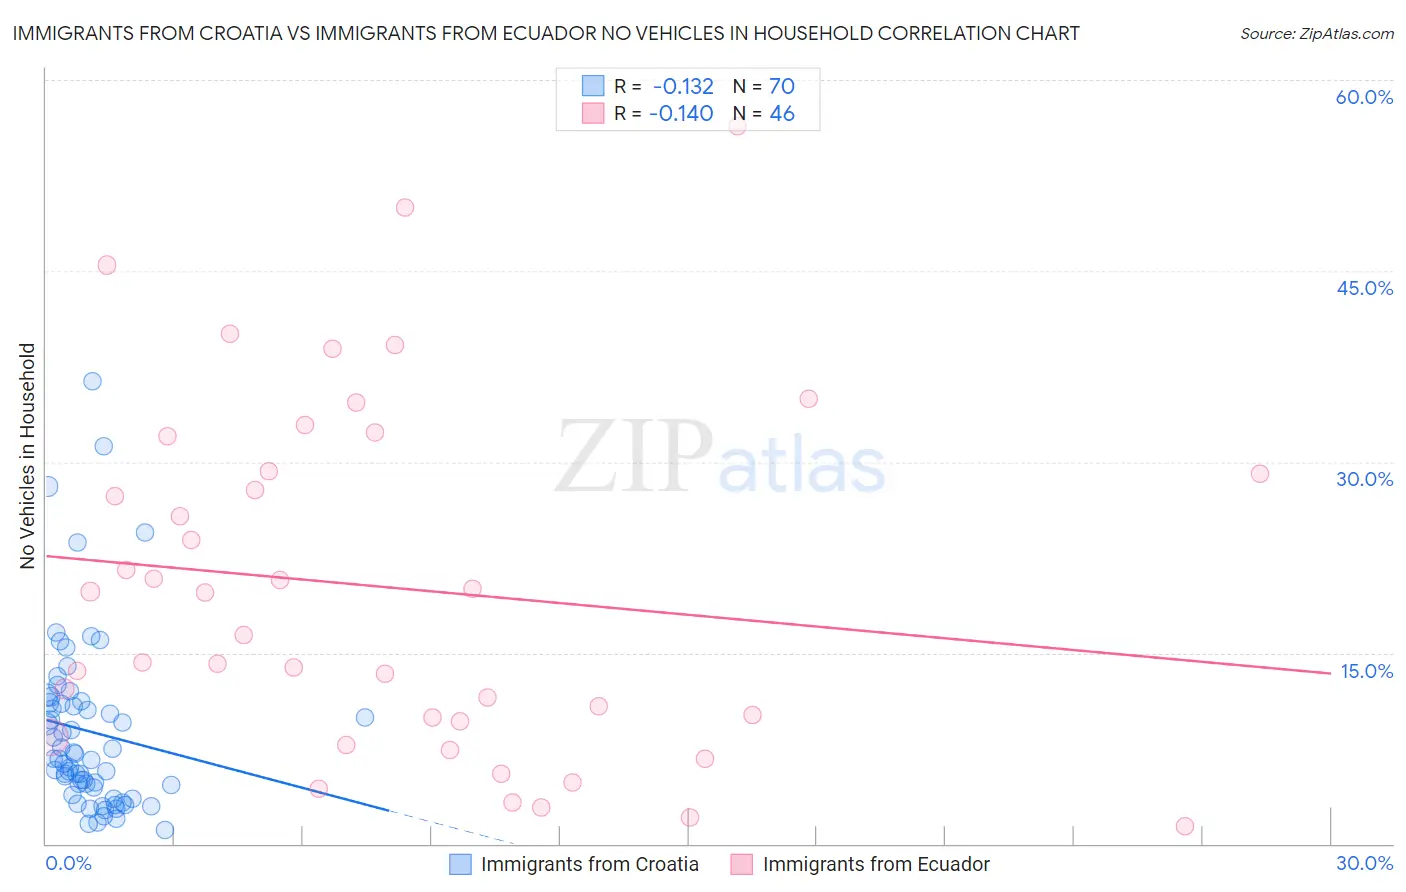
Immigrants from Croatia vs Immigrants from Ecuador No Vehicles in Household Correlation Chart
The statistical analysis conducted on geographies consisting of 132,495,212 people shows a poor negative correlation between the proportion of Immigrants from Croatia and percentage of households with no vehicle available in the United States with a correlation coefficient (R) of -0.132 and weighted average of 13.0%. Similarly, the statistical analysis conducted on geographies consisting of 270,577,361 people shows a poor negative correlation between the proportion of Immigrants from Ecuador and percentage of households with no vehicle available in the United States with a correlation coefficient (R) of -0.140 and weighted average of 23.8%, a difference of 82.8%.
No Vehicles in Household Correlation Summary
| Measurement | Immigrants from Croatia | Immigrants from Ecuador |
| Minimum | 1.1% | 1.4% |
| Maximum | 36.4% | 56.4% |
| Range | 35.3% | 54.9% |
| Mean | 8.8% | 20.1% |
| Median | 6.7% | 18.1% |
| Interquartile 25% (IQ1) | 4.4% | 9.6% |
| Interquartile 75% (IQ3) | 11.1% | 29.2% |
| Interquartile Range (IQR) | 6.7% | 19.6% |
| Standard Deviation (Sample) | 7.0% | 13.8% |
| Standard Deviation (Population) | 6.9% | 13.6% |
Similar Demographics by No Vehicles in Household
Demographics Similar to Immigrants from Croatia by No Vehicles in Household
In terms of no vehicles in household, the demographic groups most similar to Immigrants from Croatia are Aleut (13.0%, a difference of 0.040%), Immigrants from Southern Europe (13.0%, a difference of 0.12%), Immigrants from Albania (13.0%, a difference of 0.48%), Immigrants from Singapore (12.9%, a difference of 0.66%), and Mongolian (13.1%, a difference of 0.69%).
| Demographics | Rating | Rank | No Vehicles in Household |
| Immigrants | Morocco | 0.2 /100 | #271 | Tragic 12.6% |
| Bermudans | 0.1 /100 | #272 | Tragic 12.8% |
| Immigrants | France | 0.1 /100 | #273 | Tragic 12.9% |
| Immigrants | Singapore | 0.1 /100 | #274 | Tragic 12.9% |
| Immigrants | Albania | 0.1 /100 | #275 | Tragic 13.0% |
| Immigrants | Southern Europe | 0.1 /100 | #276 | Tragic 13.0% |
| Aleuts | 0.1 /100 | #277 | Tragic 13.0% |
| Immigrants | Croatia | 0.1 /100 | #278 | Tragic 13.0% |
| Mongolians | 0.0 /100 | #279 | Tragic 13.1% |
| Alsatians | 0.0 /100 | #280 | Tragic 13.2% |
| Central American Indians | 0.0 /100 | #281 | Tragic 13.3% |
| Immigrants | Eastern Asia | 0.0 /100 | #282 | Tragic 13.5% |
| Immigrants | Kazakhstan | 0.0 /100 | #283 | Tragic 13.6% |
| Immigrants | Malaysia | 0.0 /100 | #284 | Tragic 13.6% |
| Immigrants | Eastern Europe | 0.0 /100 | #285 | Tragic 13.6% |
Demographics Similar to Immigrants from Ecuador by No Vehicles in Household
In terms of no vehicles in household, the demographic groups most similar to Immigrants from Ecuador are Trinidadian and Tobagonian (23.7%, a difference of 0.33%), West Indian (23.7%, a difference of 0.51%), Immigrants from Trinidad and Tobago (24.6%, a difference of 3.4%), Ecuadorian (22.8%, a difference of 4.7%), and Immigrants from Dominica (22.2%, a difference of 7.2%).
| Demographics | Rating | Rank | No Vehicles in Household |
| Senegalese | 0.0 /100 | #325 | Tragic 19.8% |
| Immigrants | West Indies | 0.0 /100 | #326 | Tragic 20.5% |
| Immigrants | Senegal | 0.0 /100 | #327 | Tragic 21.1% |
| Immigrants | Dominica | 0.0 /100 | #328 | Tragic 22.2% |
| Ecuadorians | 0.0 /100 | #329 | Tragic 22.8% |
| West Indians | 0.0 /100 | #330 | Tragic 23.7% |
| Trinidadians and Tobagonians | 0.0 /100 | #331 | Tragic 23.7% |
| Immigrants | Ecuador | 0.0 /100 | #332 | Tragic 23.8% |
| Immigrants | Trinidad and Tobago | 0.0 /100 | #333 | Tragic 24.6% |
| Immigrants | Bangladesh | 0.0 /100 | #334 | Tragic 25.8% |
| Barbadians | 0.0 /100 | #335 | Tragic 26.1% |
| Vietnamese | 0.0 /100 | #336 | Tragic 26.2% |
| Immigrants | Uzbekistan | 0.0 /100 | #337 | Tragic 26.7% |
| Guyanese | 0.0 /100 | #338 | Tragic 29.3% |
| Dominicans | 0.0 /100 | #339 | Tragic 29.4% |