Pennsylvania German vs Immigrants from Senegal Disability Age Over 75
COMPARE
Pennsylvania German
Immigrants from Senegal
Disability Age Over 75
Disability Age Over 75 Comparison
Pennsylvania Germans
Immigrants from Senegal
47.2%
DISABILITY AGE OVER 75
66.0/ 100
METRIC RATING
162nd/ 347
METRIC RANK
47.8%
DISABILITY AGE OVER 75
16.9/ 100
METRIC RATING
208th/ 347
METRIC RANK
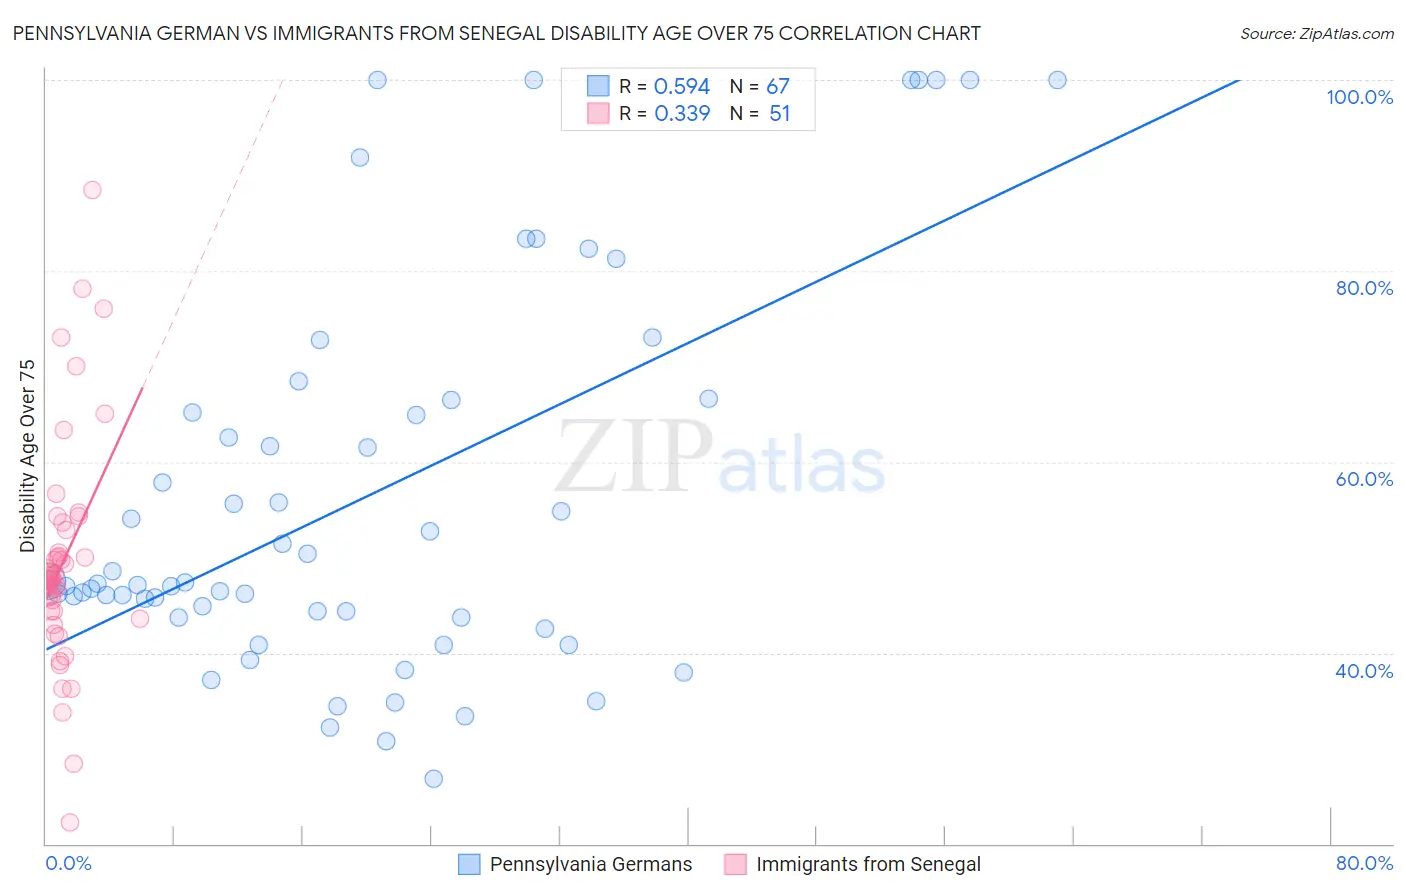
Pennsylvania German vs Immigrants from Senegal Disability Age Over 75 Correlation Chart
The statistical analysis conducted on geographies consisting of 233,972,902 people shows a substantial positive correlation between the proportion of Pennsylvania Germans and percentage of population with a disability over the age of 75 in the United States with a correlation coefficient (R) of 0.594 and weighted average of 47.2%. Similarly, the statistical analysis conducted on geographies consisting of 90,077,022 people shows a mild positive correlation between the proportion of Immigrants from Senegal and percentage of population with a disability over the age of 75 in the United States with a correlation coefficient (R) of 0.339 and weighted average of 47.8%, a difference of 1.3%.
Disability Age Over 75 Correlation Summary
| Measurement | Pennsylvania German | Immigrants from Senegal |
| Minimum | 26.8% | 22.2% |
| Maximum | 100.0% | 88.5% |
| Range | 73.2% | 66.3% |
| Mean | 56.4% | 49.6% |
| Median | 47.2% | 47.8% |
| Interquartile 25% (IQ1) | 43.8% | 44.3% |
| Interquartile 75% (IQ3) | 66.5% | 52.9% |
| Interquartile Range (IQR) | 22.8% | 8.6% |
| Standard Deviation (Sample) | 20.3% | 11.9% |
| Standard Deviation (Population) | 20.2% | 11.8% |
Similar Demographics by Disability Age Over 75
Demographics Similar to Pennsylvania Germans by Disability Age Over 75
In terms of disability age over 75, the demographic groups most similar to Pennsylvania Germans are Immigrants from Eastern Africa (47.2%, a difference of 0.010%), French (47.2%, a difference of 0.030%), Immigrants from Zimbabwe (47.2%, a difference of 0.040%), Immigrants from Sierra Leone (47.2%, a difference of 0.040%), and South American Indian (47.1%, a difference of 0.050%).
| Demographics | Rating | Rank | Disability Age Over 75 |
| Immigrants | Iran | 74.7 /100 | #155 | Good 47.1% |
| Arabs | 73.3 /100 | #156 | Good 47.1% |
| Bhutanese | 72.6 /100 | #157 | Good 47.1% |
| Immigrants | Guyana | 71.9 /100 | #158 | Good 47.1% |
| Immigrants | Morocco | 71.4 /100 | #159 | Good 47.1% |
| Immigrants | Middle Africa | 68.3 /100 | #160 | Good 47.1% |
| South American Indians | 68.1 /100 | #161 | Good 47.1% |
| Pennsylvania Germans | 66.0 /100 | #162 | Good 47.2% |
| Immigrants | Eastern Africa | 65.5 /100 | #163 | Good 47.2% |
| French | 64.6 /100 | #164 | Good 47.2% |
| Immigrants | Zimbabwe | 64.4 /100 | #165 | Good 47.2% |
| Immigrants | Sierra Leone | 64.4 /100 | #166 | Good 47.2% |
| Moroccans | 62.9 /100 | #167 | Good 47.2% |
| Kenyans | 58.8 /100 | #168 | Average 47.2% |
| Celtics | 58.7 /100 | #169 | Average 47.2% |
Demographics Similar to Immigrants from Senegal by Disability Age Over 75
In terms of disability age over 75, the demographic groups most similar to Immigrants from Senegal are Immigrants from Syria (47.8%, a difference of 0.020%), Immigrants from Ghana (47.7%, a difference of 0.080%), Jamaican (47.7%, a difference of 0.080%), Nigerian (47.7%, a difference of 0.090%), and Immigrants from Indonesia (47.8%, a difference of 0.11%).
| Demographics | Rating | Rank | Disability Age Over 75 |
| Immigrants | Cuba | 20.9 /100 | #201 | Fair 47.7% |
| Immigrants | Bahamas | 20.7 /100 | #202 | Fair 47.7% |
| Trinidadians and Tobagonians | 20.0 /100 | #203 | Fair 47.7% |
| Nigerians | 19.2 /100 | #204 | Poor 47.7% |
| Immigrants | Ghana | 19.1 /100 | #205 | Poor 47.7% |
| Jamaicans | 19.0 /100 | #206 | Poor 47.7% |
| Immigrants | Syria | 17.4 /100 | #207 | Poor 47.8% |
| Immigrants | Senegal | 16.9 /100 | #208 | Poor 47.8% |
| Immigrants | Indonesia | 14.2 /100 | #209 | Poor 47.8% |
| Vietnamese | 11.9 /100 | #210 | Poor 47.9% |
| Panamanians | 11.8 /100 | #211 | Poor 47.9% |
| Immigrants | Burma/Myanmar | 11.7 /100 | #212 | Poor 47.9% |
| Laotians | 11.5 /100 | #213 | Poor 47.9% |
| Immigrants | Barbados | 10.7 /100 | #214 | Poor 47.9% |
| Senegalese | 10.7 /100 | #215 | Poor 47.9% |