Ottawa vs Blackfeet No Vehicles in Household
COMPARE
Ottawa
Blackfeet
No Vehicles in Household
No Vehicles in Household Comparison
Ottawa
Blackfeet
7.4%
NO VEHICLES IN HOUSEHOLD
100.0/ 100
METRIC RATING
20th/ 347
METRIC RANK
9.6%
NO VEHICLES IN HOUSEHOLD
91.4/ 100
METRIC RATING
123rd/ 347
METRIC RANK
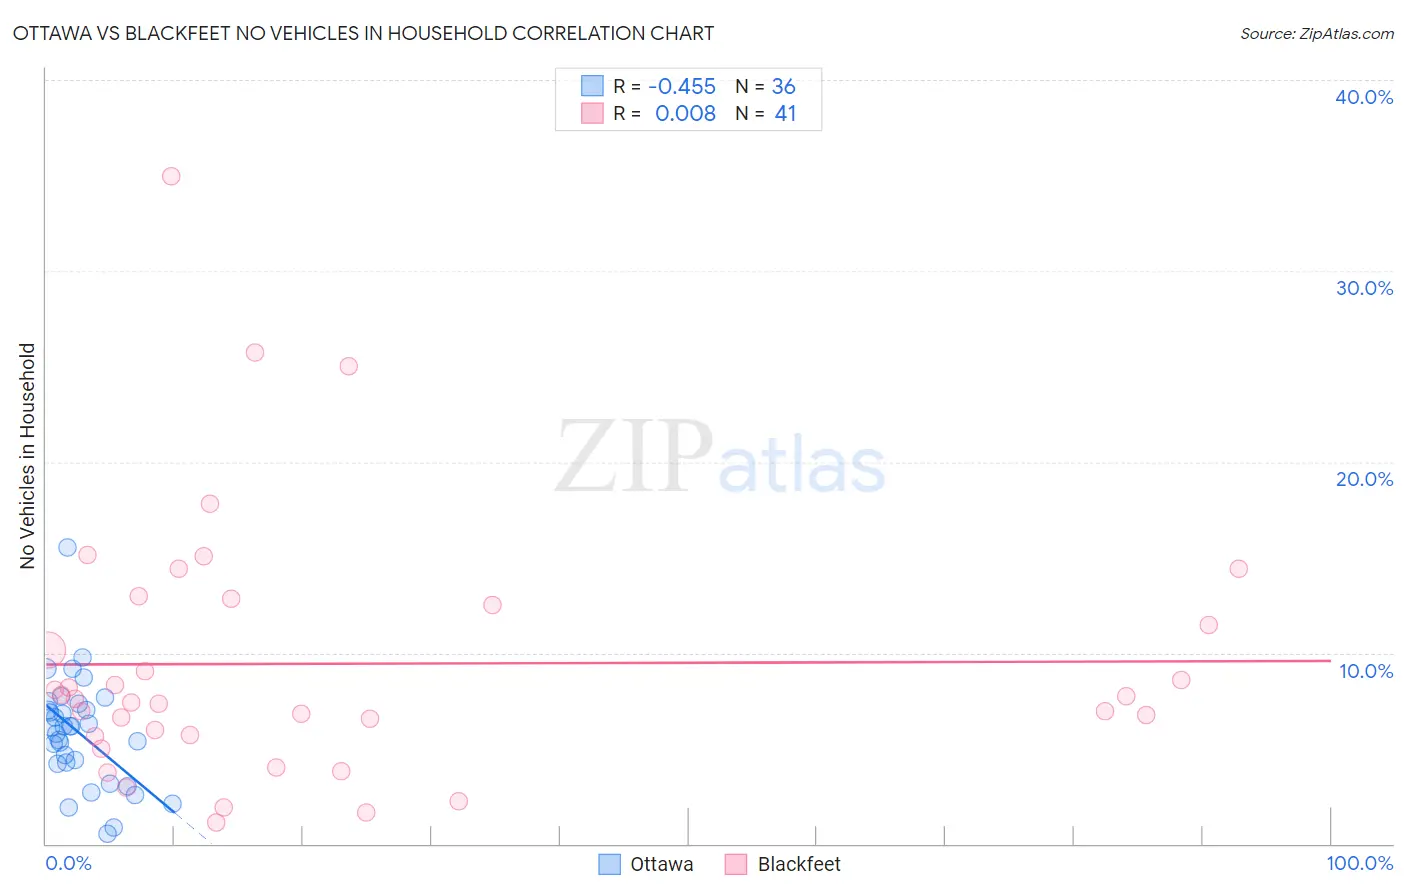
Ottawa vs Blackfeet No Vehicles in Household Correlation Chart
The statistical analysis conducted on geographies consisting of 49,929,358 people shows a moderate negative correlation between the proportion of Ottawa and percentage of households with no vehicle available in the United States with a correlation coefficient (R) of -0.455 and weighted average of 7.4%. Similarly, the statistical analysis conducted on geographies consisting of 309,020,066 people shows no correlation between the proportion of Blackfeet and percentage of households with no vehicle available in the United States with a correlation coefficient (R) of 0.008 and weighted average of 9.6%, a difference of 29.7%.
No Vehicles in Household Correlation Summary
| Measurement | Ottawa | Blackfeet |
| Minimum | 0.55% | 1.1% |
| Maximum | 15.5% | 34.9% |
| Range | 15.0% | 33.8% |
| Mean | 5.8% | 9.4% |
| Median | 6.1% | 7.6% |
| Interquartile 25% (IQ1) | 4.2% | 5.7% |
| Interquartile 75% (IQ3) | 7.2% | 12.7% |
| Interquartile Range (IQR) | 3.0% | 7.0% |
| Standard Deviation (Sample) | 2.9% | 6.9% |
| Standard Deviation (Population) | 2.8% | 6.8% |
Similar Demographics by No Vehicles in Household
Demographics Similar to Ottawa by No Vehicles in Household
In terms of no vehicles in household, the demographic groups most similar to Ottawa are Nepalese (7.4%, a difference of 0.15%), Arapaho (7.4%, a difference of 0.42%), Irish (7.4%, a difference of 0.75%), French (7.4%, a difference of 0.80%), and Immigrants from Iraq (7.5%, a difference of 1.2%).
| Demographics | Rating | Rank | No Vehicles in Household |
| Scandinavians | 100.0 /100 | #13 | Exceptional 7.0% |
| Mexicans | 100.0 /100 | #14 | Exceptional 7.0% |
| Whites/Caucasians | 100.0 /100 | #15 | Exceptional 7.0% |
| Europeans | 100.0 /100 | #16 | Exceptional 7.1% |
| Welsh | 100.0 /100 | #17 | Exceptional 7.2% |
| Tongans | 100.0 /100 | #18 | Exceptional 7.2% |
| Arapaho | 100.0 /100 | #19 | Exceptional 7.4% |
| Ottawa | 100.0 /100 | #20 | Exceptional 7.4% |
| Nepalese | 100.0 /100 | #21 | Exceptional 7.4% |
| Irish | 100.0 /100 | #22 | Exceptional 7.4% |
| French | 100.0 /100 | #23 | Exceptional 7.4% |
| Immigrants | Iraq | 100.0 /100 | #24 | Exceptional 7.5% |
| Yaqui | 100.0 /100 | #25 | Exceptional 7.5% |
| Sri Lankans | 100.0 /100 | #26 | Exceptional 7.6% |
| British | 100.0 /100 | #27 | Exceptional 7.6% |
Demographics Similar to Blackfeet by No Vehicles in Household
In terms of no vehicles in household, the demographic groups most similar to Blackfeet are Immigrants from Korea (9.6%, a difference of 0.23%), Immigrants from Cameroon (9.6%, a difference of 0.36%), Costa Rican (9.5%, a difference of 0.46%), Puget Sound Salish (9.5%, a difference of 0.51%), and Icelander (9.6%, a difference of 0.52%).
| Demographics | Rating | Rank | No Vehicles in Household |
| Japanese | 94.1 /100 | #116 | Exceptional 9.4% |
| Chippewa | 93.8 /100 | #117 | Exceptional 9.4% |
| Greeks | 92.9 /100 | #118 | Exceptional 9.5% |
| Fijians | 92.7 /100 | #119 | Exceptional 9.5% |
| Immigrants | Thailand | 92.6 /100 | #120 | Exceptional 9.5% |
| Puget Sound Salish | 92.4 /100 | #121 | Exceptional 9.5% |
| Costa Ricans | 92.3 /100 | #122 | Exceptional 9.5% |
| Blackfeet | 91.4 /100 | #123 | Exceptional 9.6% |
| Immigrants | Korea | 90.9 /100 | #124 | Exceptional 9.6% |
| Immigrants | Cameroon | 90.6 /100 | #125 | Exceptional 9.6% |
| Icelanders | 90.2 /100 | #126 | Exceptional 9.6% |
| Immigrants | Kenya | 89.7 /100 | #127 | Excellent 9.6% |
| Immigrants | Syria | 89.5 /100 | #128 | Excellent 9.6% |
| Nicaraguans | 89.5 /100 | #129 | Excellent 9.7% |
| Burmese | 88.8 /100 | #130 | Excellent 9.7% |