Ottawa vs Northern European No Vehicles in Household
COMPARE
Ottawa
Northern European
No Vehicles in Household
No Vehicles in Household Comparison
Ottawa
Northern Europeans
7.4%
NO VEHICLES IN HOUSEHOLD
100.0/ 100
METRIC RATING
20th/ 347
METRIC RANK
7.9%
NO VEHICLES IN HOUSEHOLD
99.9/ 100
METRIC RATING
47th/ 347
METRIC RANK
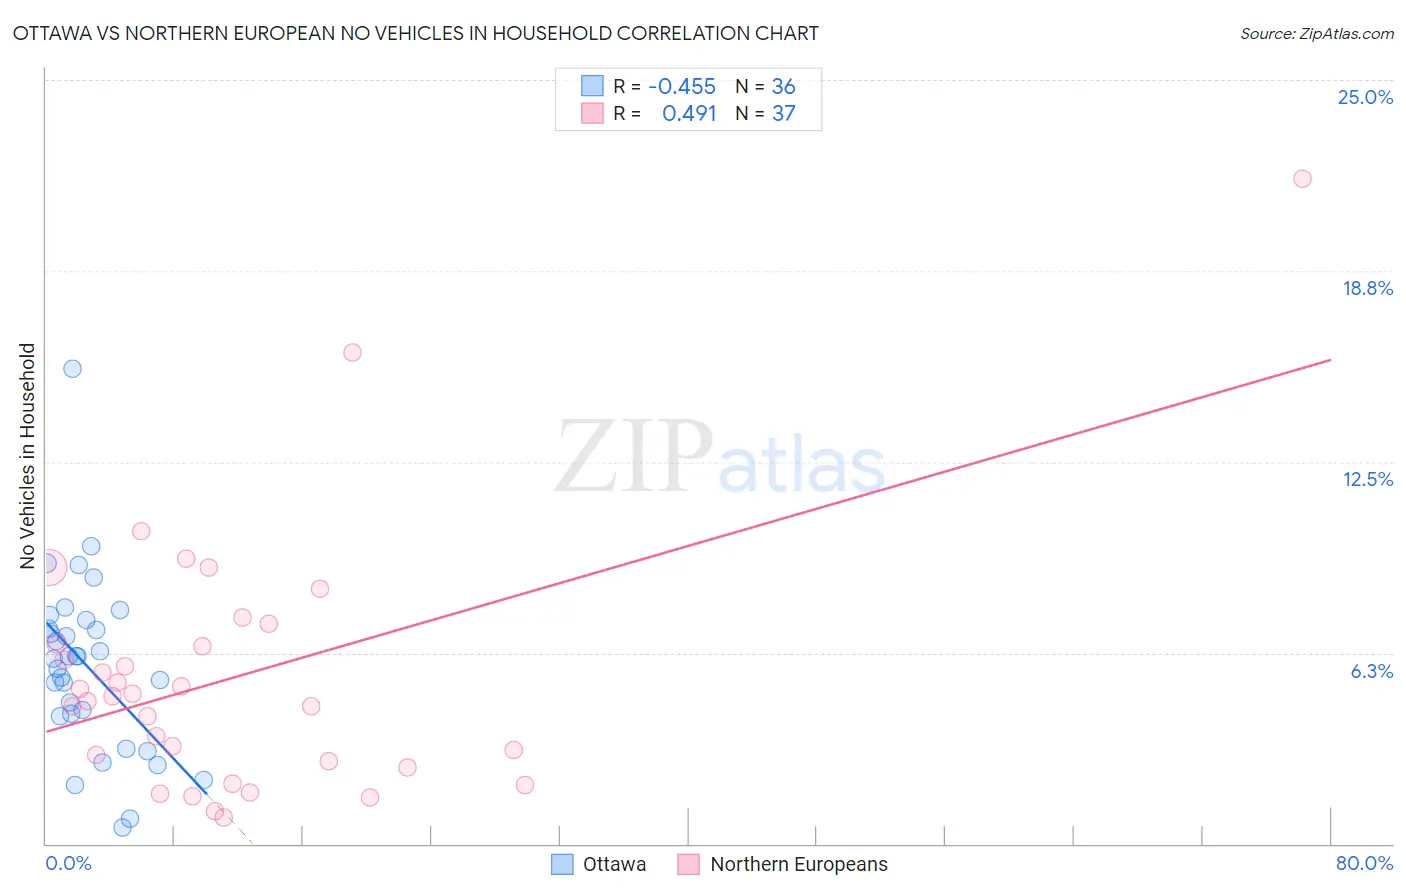
Ottawa vs Northern European No Vehicles in Household Correlation Chart
The statistical analysis conducted on geographies consisting of 49,929,358 people shows a moderate negative correlation between the proportion of Ottawa and percentage of households with no vehicle available in the United States with a correlation coefficient (R) of -0.455 and weighted average of 7.4%. Similarly, the statistical analysis conducted on geographies consisting of 404,742,877 people shows a moderate positive correlation between the proportion of Northern Europeans and percentage of households with no vehicle available in the United States with a correlation coefficient (R) of 0.491 and weighted average of 7.9%, a difference of 7.4%.
No Vehicles in Household Correlation Summary
| Measurement | Ottawa | Northern European |
| Minimum | 0.55% | 0.88% |
| Maximum | 15.5% | 21.8% |
| Range | 15.0% | 20.9% |
| Mean | 5.8% | 5.5% |
| Median | 6.1% | 4.8% |
| Interquartile 25% (IQ1) | 4.2% | 2.6% |
| Interquartile 75% (IQ3) | 7.2% | 6.9% |
| Interquartile Range (IQR) | 3.0% | 4.3% |
| Standard Deviation (Sample) | 2.9% | 4.2% |
| Standard Deviation (Population) | 2.8% | 4.1% |
Similar Demographics by No Vehicles in Household
Demographics Similar to Ottawa by No Vehicles in Household
In terms of no vehicles in household, the demographic groups most similar to Ottawa are Nepalese (7.4%, a difference of 0.15%), Arapaho (7.4%, a difference of 0.42%), Irish (7.4%, a difference of 0.75%), French (7.4%, a difference of 0.80%), and Immigrants from Iraq (7.5%, a difference of 1.2%).
| Demographics | Rating | Rank | No Vehicles in Household |
| Scandinavians | 100.0 /100 | #13 | Exceptional 7.0% |
| Mexicans | 100.0 /100 | #14 | Exceptional 7.0% |
| Whites/Caucasians | 100.0 /100 | #15 | Exceptional 7.0% |
| Europeans | 100.0 /100 | #16 | Exceptional 7.1% |
| Welsh | 100.0 /100 | #17 | Exceptional 7.2% |
| Tongans | 100.0 /100 | #18 | Exceptional 7.2% |
| Arapaho | 100.0 /100 | #19 | Exceptional 7.4% |
| Ottawa | 100.0 /100 | #20 | Exceptional 7.4% |
| Nepalese | 100.0 /100 | #21 | Exceptional 7.4% |
| Irish | 100.0 /100 | #22 | Exceptional 7.4% |
| French | 100.0 /100 | #23 | Exceptional 7.4% |
| Immigrants | Iraq | 100.0 /100 | #24 | Exceptional 7.5% |
| Yaqui | 100.0 /100 | #25 | Exceptional 7.5% |
| Sri Lankans | 100.0 /100 | #26 | Exceptional 7.6% |
| British | 100.0 /100 | #27 | Exceptional 7.6% |
Demographics Similar to Northern Europeans by No Vehicles in Household
In terms of no vehicles in household, the demographic groups most similar to Northern Europeans are Spanish (7.9%, a difference of 0.12%), Nonimmigrants (7.9%, a difference of 0.38%), Afghan (8.0%, a difference of 0.47%), Choctaw (7.9%, a difference of 0.55%), and Guamanian/Chamorro (8.0%, a difference of 0.65%).
| Demographics | Rating | Rank | No Vehicles in Household |
| Czechoslovakians | 99.9 /100 | #40 | Exceptional 7.8% |
| French Canadians | 99.9 /100 | #41 | Exceptional 7.8% |
| Swiss | 99.9 /100 | #42 | Exceptional 7.9% |
| Chickasaw | 99.9 /100 | #43 | Exceptional 7.9% |
| Choctaw | 99.9 /100 | #44 | Exceptional 7.9% |
| Immigrants | Nonimmigrants | 99.9 /100 | #45 | Exceptional 7.9% |
| Spanish | 99.9 /100 | #46 | Exceptional 7.9% |
| Northern Europeans | 99.9 /100 | #47 | Exceptional 7.9% |
| Afghans | 99.9 /100 | #48 | Exceptional 8.0% |
| Guamanians/Chamorros | 99.9 /100 | #49 | Exceptional 8.0% |
| Belgians | 99.9 /100 | #50 | Exceptional 8.0% |
| Koreans | 99.9 /100 | #51 | Exceptional 8.0% |
| Hawaiians | 99.9 /100 | #52 | Exceptional 8.0% |
| Slovenes | 99.9 /100 | #53 | Exceptional 8.0% |
| Immigrants | Venezuela | 99.9 /100 | #54 | Exceptional 8.1% |