Norwegian vs Immigrants from Belgium 2 or more Vehicles in Household
COMPARE
Norwegian
Immigrants from Belgium
2 or more Vehicles in Household
2 or more Vehicles in Household Comparison
Norwegians
Immigrants from Belgium
62.8%
2 OR MORE VEHICLES IN HOUSEHOLD
100.0/ 100
METRIC RATING
4th/ 347
METRIC RANK
54.3%
2 OR MORE VEHICLES IN HOUSEHOLD
13.7/ 100
METRIC RATING
204th/ 347
METRIC RANK
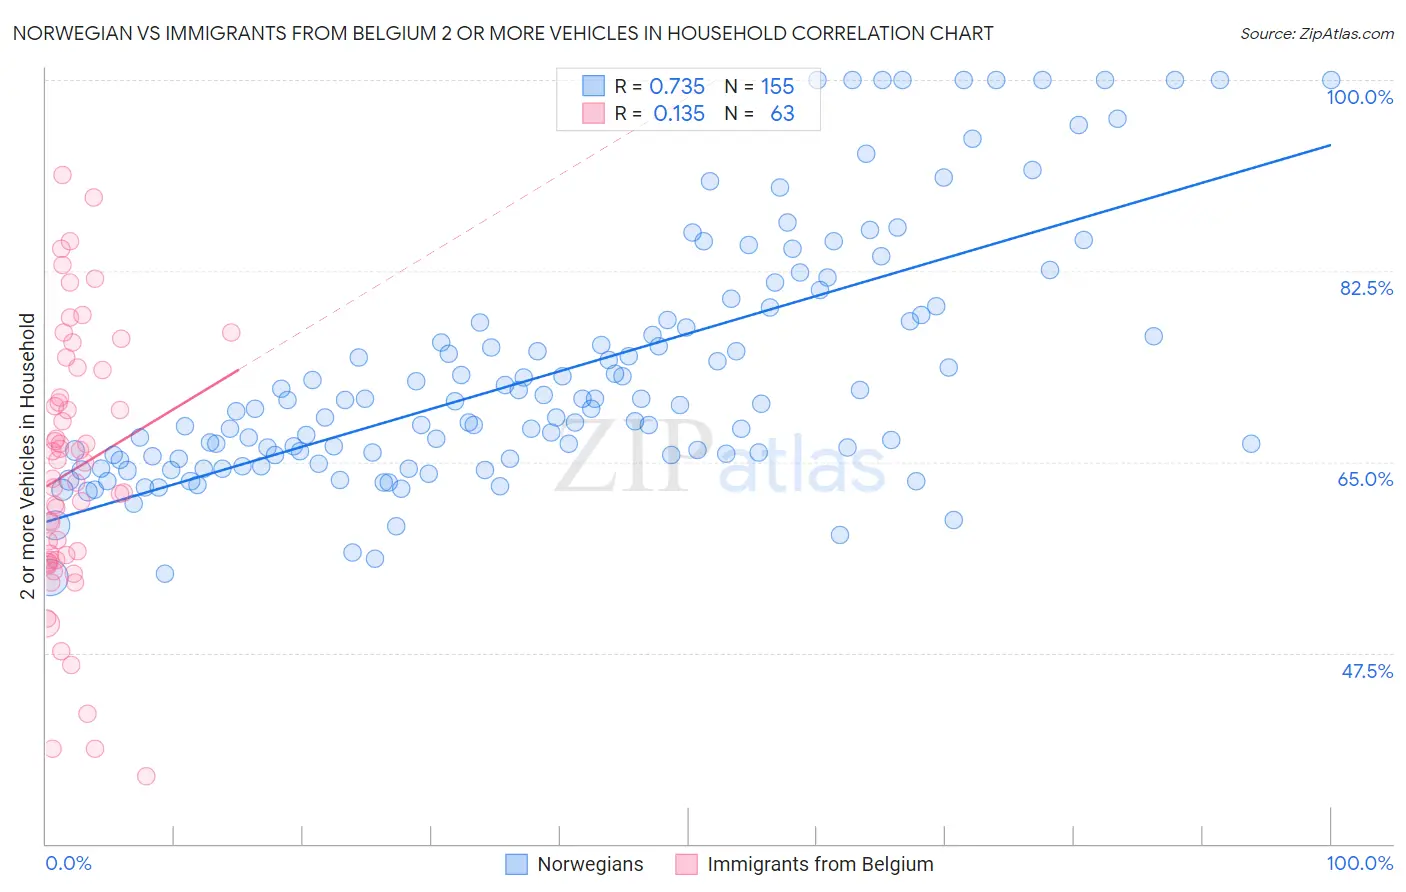
Norwegian vs Immigrants from Belgium 2 or more Vehicles in Household Correlation Chart
The statistical analysis conducted on geographies consisting of 532,963,980 people shows a strong positive correlation between the proportion of Norwegians and percentage of households with 2 or more vehicles available in the United States with a correlation coefficient (R) of 0.735 and weighted average of 62.8%. Similarly, the statistical analysis conducted on geographies consisting of 146,670,749 people shows a poor positive correlation between the proportion of Immigrants from Belgium and percentage of households with 2 or more vehicles available in the United States with a correlation coefficient (R) of 0.135 and weighted average of 54.3%, a difference of 15.7%.
2 or more Vehicles in Household Correlation Summary
| Measurement | Norwegian | Immigrants from Belgium |
| Minimum | 54.4% | 36.2% |
| Maximum | 100.0% | 91.3% |
| Range | 45.6% | 55.1% |
| Mean | 73.2% | 64.2% |
| Median | 69.9% | 63.5% |
| Interquartile 25% (IQ1) | 65.3% | 56.0% |
| Interquartile 75% (IQ3) | 78.0% | 73.5% |
| Interquartile Range (IQR) | 12.7% | 17.4% |
| Standard Deviation (Sample) | 11.3% | 12.3% |
| Standard Deviation (Population) | 11.3% | 12.2% |
Similar Demographics by 2 or more Vehicles in Household
Demographics Similar to Norwegians by 2 or more Vehicles in Household
In terms of 2 or more vehicles in household, the demographic groups most similar to Norwegians are Danish (63.3%, a difference of 0.69%), Immigrants from Fiji (62.3%, a difference of 0.87%), Tongan (63.5%, a difference of 1.1%), Scandinavian (62.1%, a difference of 1.2%), and Puget Sound Salish (62.1%, a difference of 1.3%).
| Demographics | Rating | Rank | 2 or more Vehicles in Household |
| Yakama | 100.0 /100 | #1 | Exceptional 64.9% |
| Tongans | 100.0 /100 | #2 | Exceptional 63.5% |
| Danes | 100.0 /100 | #3 | Exceptional 63.3% |
| Norwegians | 100.0 /100 | #4 | Exceptional 62.8% |
| Immigrants | Fiji | 100.0 /100 | #5 | Exceptional 62.3% |
| Scandinavians | 100.0 /100 | #6 | Exceptional 62.1% |
| Puget Sound Salish | 100.0 /100 | #7 | Exceptional 62.1% |
| English | 100.0 /100 | #8 | Exceptional 61.9% |
| Swedes | 100.0 /100 | #9 | Exceptional 61.8% |
| Mexicans | 100.0 /100 | #10 | Exceptional 61.7% |
| Dutch | 100.0 /100 | #11 | Exceptional 61.6% |
| Germans | 100.0 /100 | #12 | Exceptional 61.6% |
| Samoans | 100.0 /100 | #13 | Exceptional 61.5% |
| Czechs | 100.0 /100 | #14 | Exceptional 61.5% |
| Nepalese | 100.0 /100 | #15 | Exceptional 61.4% |
Demographics Similar to Immigrants from Belgium by 2 or more Vehicles in Household
In terms of 2 or more vehicles in household, the demographic groups most similar to Immigrants from Belgium are Cheyenne (54.3%, a difference of 0.010%), Immigrants from Peru (54.4%, a difference of 0.050%), Immigrants from Latin America (54.3%, a difference of 0.060%), Turkish (54.3%, a difference of 0.070%), and Immigrants from North Macedonia (54.4%, a difference of 0.090%).
| Demographics | Rating | Rank | 2 or more Vehicles in Household |
| Argentineans | 17.5 /100 | #197 | Poor 54.5% |
| Carpatho Rusyns | 16.2 /100 | #198 | Poor 54.4% |
| Immigrants | Norway | 15.9 /100 | #199 | Poor 54.4% |
| Houma | 15.8 /100 | #200 | Poor 54.4% |
| Immigrants | Italy | 15.5 /100 | #201 | Poor 54.4% |
| Immigrants | North Macedonia | 14.9 /100 | #202 | Poor 54.4% |
| Immigrants | Peru | 14.3 /100 | #203 | Poor 54.4% |
| Immigrants | Belgium | 13.7 /100 | #204 | Poor 54.3% |
| Cheyenne | 13.6 /100 | #205 | Poor 54.3% |
| Immigrants | Latin America | 13.1 /100 | #206 | Poor 54.3% |
| Turks | 13.0 /100 | #207 | Poor 54.3% |
| Egyptians | 12.0 /100 | #208 | Poor 54.3% |
| Immigrants | Bulgaria | 12.0 /100 | #209 | Poor 54.3% |
| Immigrants | Saudi Arabia | 11.3 /100 | #210 | Poor 54.2% |
| Immigrants | Hungary | 11.3 /100 | #211 | Poor 54.2% |