Nicaraguan vs Yugoslavian Unemployment Among Ages 45 to 54 years
COMPARE
Nicaraguan
Yugoslavian
Unemployment Among Ages 45 to 54 years
Unemployment Among Ages 45 to 54 years Comparison
Nicaraguans
Yugoslavians
4.4%
UNEMPLOYMENT AMONG AGES 45 TO 54 YEARS
87.6/ 100
METRIC RATING
127th/ 347
METRIC RANK
4.1%
UNEMPLOYMENT AMONG AGES 45 TO 54 YEARS
100.0/ 100
METRIC RATING
22nd/ 347
METRIC RANK
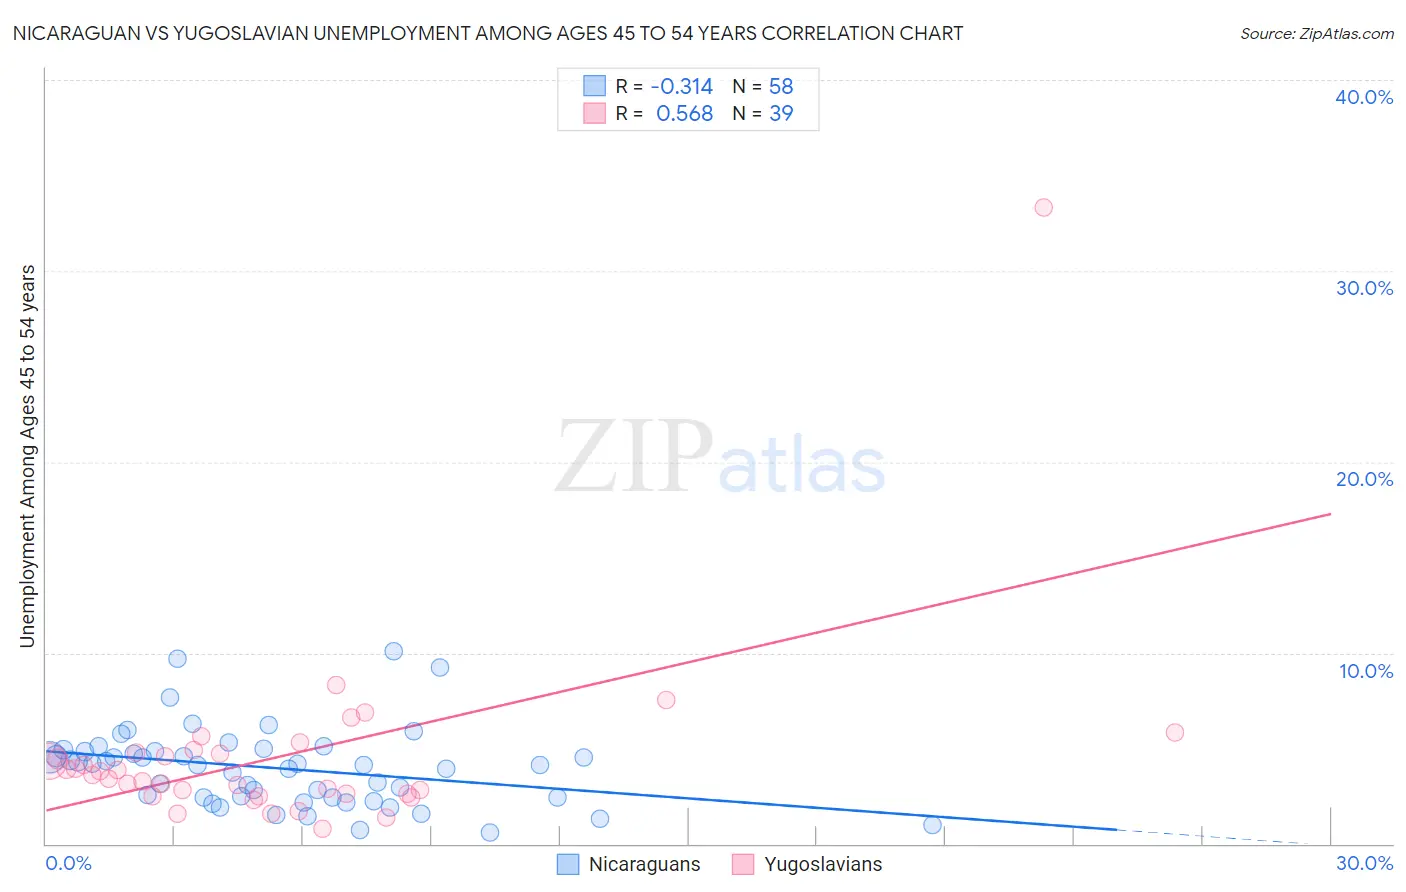
Nicaraguan vs Yugoslavian Unemployment Among Ages 45 to 54 years Correlation Chart
The statistical analysis conducted on geographies consisting of 282,332,859 people shows a mild negative correlation between the proportion of Nicaraguans and unemployment rate among population between the ages 45 and 54 in the United States with a correlation coefficient (R) of -0.314 and weighted average of 4.4%. Similarly, the statistical analysis conducted on geographies consisting of 280,013,183 people shows a substantial positive correlation between the proportion of Yugoslavians and unemployment rate among population between the ages 45 and 54 in the United States with a correlation coefficient (R) of 0.568 and weighted average of 4.1%, a difference of 8.0%.
Unemployment Among Ages 45 to 54 years Correlation Summary
| Measurement | Nicaraguan | Yugoslavian |
| Minimum | 0.60% | 0.80% |
| Maximum | 10.1% | 33.3% |
| Range | 9.5% | 32.5% |
| Mean | 4.0% | 4.5% |
| Median | 4.2% | 3.6% |
| Interquartile 25% (IQ1) | 2.4% | 2.6% |
| Interquartile 75% (IQ3) | 4.9% | 4.8% |
| Interquartile Range (IQR) | 2.5% | 2.2% |
| Standard Deviation (Sample) | 2.0% | 5.0% |
| Standard Deviation (Population) | 2.0% | 5.0% |
Similar Demographics by Unemployment Among Ages 45 to 54 years
Demographics Similar to Nicaraguans by Unemployment Among Ages 45 to 54 years
In terms of unemployment among ages 45 to 54 years, the demographic groups most similar to Nicaraguans are Immigrants from Czechoslovakia (4.4%, a difference of 0.010%), Immigrants from Northern Europe (4.4%, a difference of 0.080%), Immigrants from Vietnam (4.4%, a difference of 0.11%), Immigrants from Asia (4.4%, a difference of 0.13%), and Spanish (4.4%, a difference of 0.13%).
| Demographics | Rating | Rank | Unemployment Among Ages 45 to 54 years |
| Americans | 89.6 /100 | #120 | Excellent 4.4% |
| Immigrants | Oceania | 89.5 /100 | #121 | Excellent 4.4% |
| Immigrants | Kazakhstan | 89.5 /100 | #122 | Excellent 4.4% |
| Immigrants | Asia | 88.8 /100 | #123 | Excellent 4.4% |
| Spanish | 88.8 /100 | #124 | Excellent 4.4% |
| Immigrants | Vietnam | 88.6 /100 | #125 | Excellent 4.4% |
| Immigrants | Czechoslovakia | 87.8 /100 | #126 | Excellent 4.4% |
| Nicaraguans | 87.6 /100 | #127 | Excellent 4.4% |
| Immigrants | Northern Europe | 86.9 /100 | #128 | Excellent 4.4% |
| Laotians | 86.3 /100 | #129 | Excellent 4.4% |
| Celtics | 86.2 /100 | #130 | Excellent 4.4% |
| Immigrants | Germany | 85.9 /100 | #131 | Excellent 4.4% |
| Immigrants | Eastern Africa | 85.1 /100 | #132 | Excellent 4.4% |
| Immigrants | Cameroon | 84.8 /100 | #133 | Excellent 4.4% |
| Afghans | 84.6 /100 | #134 | Excellent 4.4% |
Demographics Similar to Yugoslavians by Unemployment Among Ages 45 to 54 years
In terms of unemployment among ages 45 to 54 years, the demographic groups most similar to Yugoslavians are Bulgarian (4.1%, a difference of 0.010%), European (4.1%, a difference of 0.090%), English (4.1%, a difference of 0.42%), Swiss (4.1%, a difference of 0.58%), and Carpatho Rusyn (4.1%, a difference of 0.66%).
| Demographics | Rating | Rank | Unemployment Among Ages 45 to 54 years |
| Immigrants | Bolivia | 100.0 /100 | #15 | Exceptional 4.0% |
| Thais | 100.0 /100 | #16 | Exceptional 4.0% |
| Tongans | 100.0 /100 | #17 | Exceptional 4.1% |
| Germans | 100.0 /100 | #18 | Exceptional 4.1% |
| Swiss | 100.0 /100 | #19 | Exceptional 4.1% |
| English | 100.0 /100 | #20 | Exceptional 4.1% |
| Europeans | 100.0 /100 | #21 | Exceptional 4.1% |
| Yugoslavians | 100.0 /100 | #22 | Exceptional 4.1% |
| Bulgarians | 100.0 /100 | #23 | Exceptional 4.1% |
| Carpatho Rusyns | 100.0 /100 | #24 | Exceptional 4.1% |
| Bolivians | 99.9 /100 | #25 | Exceptional 4.1% |
| Scottish | 99.9 /100 | #26 | Exceptional 4.1% |
| Immigrants | Moldova | 99.9 /100 | #27 | Exceptional 4.1% |
| Welsh | 99.9 /100 | #28 | Exceptional 4.1% |
| Belgians | 99.9 /100 | #29 | Exceptional 4.1% |