Nicaraguan vs Immigrants from Bulgaria No Schooling Completed
COMPARE
Nicaraguan
Immigrants from Bulgaria
No Schooling Completed
No Schooling Completed Comparison
Nicaraguans
Immigrants from Bulgaria
2.9%
NO SCHOOLING COMPLETED
0.0/ 100
METRIC RATING
304th/ 347
METRIC RANK
1.9%
NO SCHOOLING COMPLETED
94.6/ 100
METRIC RATING
120th/ 347
METRIC RANK
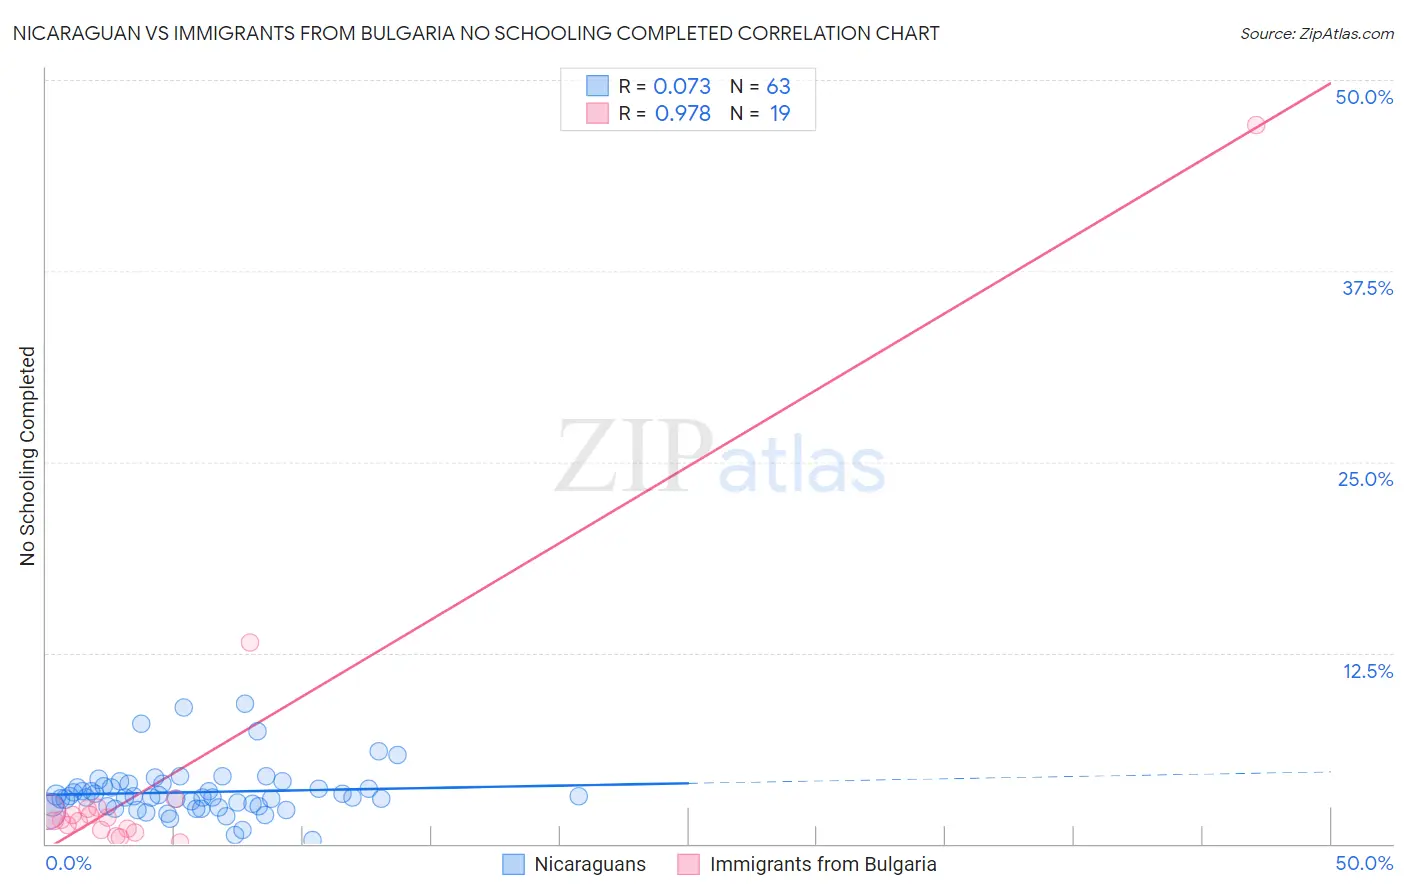
Nicaraguan vs Immigrants from Bulgaria No Schooling Completed Correlation Chart
The statistical analysis conducted on geographies consisting of 284,425,297 people shows a slight positive correlation between the proportion of Nicaraguans and percentage of population with no schooling in the United States with a correlation coefficient (R) of 0.073 and weighted average of 2.9%. Similarly, the statistical analysis conducted on geographies consisting of 171,926,286 people shows a perfect positive correlation between the proportion of Immigrants from Bulgaria and percentage of population with no schooling in the United States with a correlation coefficient (R) of 0.978 and weighted average of 1.9%, a difference of 55.6%.
No Schooling Completed Correlation Summary
| Measurement | Nicaraguan | Immigrants from Bulgaria |
| Minimum | 0.24% | 0.085% |
| Maximum | 9.2% | 47.1% |
| Range | 9.0% | 47.0% |
| Mean | 3.4% | 4.5% |
| Median | 3.1% | 1.5% |
| Interquartile 25% (IQ1) | 2.4% | 0.90% |
| Interquartile 75% (IQ3) | 3.8% | 2.3% |
| Interquartile Range (IQR) | 1.3% | 1.4% |
| Standard Deviation (Sample) | 1.7% | 10.7% |
| Standard Deviation (Population) | 1.6% | 10.4% |
Similar Demographics by No Schooling Completed
Demographics Similar to Nicaraguans by No Schooling Completed
In terms of no schooling completed, the demographic groups most similar to Nicaraguans are Somali (2.9%, a difference of 0.19%), Ecuadorian (3.0%, a difference of 0.47%), Immigrants from Caribbean (2.9%, a difference of 1.2%), Immigrants from South Eastern Asia (2.9%, a difference of 1.5%), and Belizean (3.0%, a difference of 2.1%).
| Demographics | Rating | Rank | No Schooling Completed |
| Immigrants | Cuba | 0.0 /100 | #297 | Tragic 2.8% |
| Immigrants | Dominica | 0.0 /100 | #298 | Tragic 2.8% |
| Central American Indians | 0.0 /100 | #299 | Tragic 2.8% |
| Haitians | 0.0 /100 | #300 | Tragic 2.9% |
| Immigrants | South Eastern Asia | 0.0 /100 | #301 | Tragic 2.9% |
| Immigrants | Caribbean | 0.0 /100 | #302 | Tragic 2.9% |
| Somalis | 0.0 /100 | #303 | Tragic 2.9% |
| Nicaraguans | 0.0 /100 | #304 | Tragic 2.9% |
| Ecuadorians | 0.0 /100 | #305 | Tragic 3.0% |
| Belizeans | 0.0 /100 | #306 | Tragic 3.0% |
| Immigrants | Haiti | 0.0 /100 | #307 | Tragic 3.0% |
| Immigrants | Somalia | 0.0 /100 | #308 | Tragic 3.0% |
| Hispanics or Latinos | 0.0 /100 | #309 | Tragic 3.0% |
| Guyanese | 0.0 /100 | #310 | Tragic 3.0% |
| Immigrants | Azores | 0.0 /100 | #311 | Tragic 3.0% |
Demographics Similar to Immigrants from Bulgaria by No Schooling Completed
In terms of no schooling completed, the demographic groups most similar to Immigrants from Bulgaria are Immigrants from Croatia (1.9%, a difference of 0.060%), Cree (1.9%, a difference of 0.090%), Iroquois (1.9%, a difference of 0.40%), Immigrants from Kuwait (1.9%, a difference of 0.46%), and Cambodian (1.9%, a difference of 0.53%).
| Demographics | Rating | Rank | No Schooling Completed |
| Immigrants | Zimbabwe | 96.2 /100 | #113 | Exceptional 1.9% |
| Immigrants | Norway | 96.1 /100 | #114 | Exceptional 1.9% |
| Syrians | 96.0 /100 | #115 | Exceptional 1.9% |
| Lebanese | 96.0 /100 | #116 | Exceptional 1.9% |
| Immigrants | Serbia | 95.8 /100 | #117 | Exceptional 1.9% |
| Spanish | 95.5 /100 | #118 | Exceptional 1.9% |
| Iroquois | 95.1 /100 | #119 | Exceptional 1.9% |
| Immigrants | Bulgaria | 94.6 /100 | #120 | Exceptional 1.9% |
| Immigrants | Croatia | 94.5 /100 | #121 | Exceptional 1.9% |
| Cree | 94.5 /100 | #122 | Exceptional 1.9% |
| Immigrants | Kuwait | 93.9 /100 | #123 | Exceptional 1.9% |
| Cambodians | 93.8 /100 | #124 | Exceptional 1.9% |
| Immigrants | Europe | 93.7 /100 | #125 | Exceptional 1.9% |
| Immigrants | Romania | 92.6 /100 | #126 | Exceptional 1.9% |
| Israelis | 92.4 /100 | #127 | Exceptional 1.9% |