New Zealander vs Immigrants from Cameroon Householder Income Ages 45 - 64 years
COMPARE
New Zealander
Immigrants from Cameroon
Householder Income Ages 45 - 64 years
Householder Income Ages 45 - 64 years Comparison
New Zealanders
Immigrants from Cameroon
$111,286
HOUSEHOLDER INCOME AGES 45 - 64 YEARS
99.6/ 100
METRIC RATING
66th/ 347
METRIC RANK
$100,084
HOUSEHOLDER INCOME AGES 45 - 64 YEARS
47.0/ 100
METRIC RATING
178th/ 347
METRIC RANK
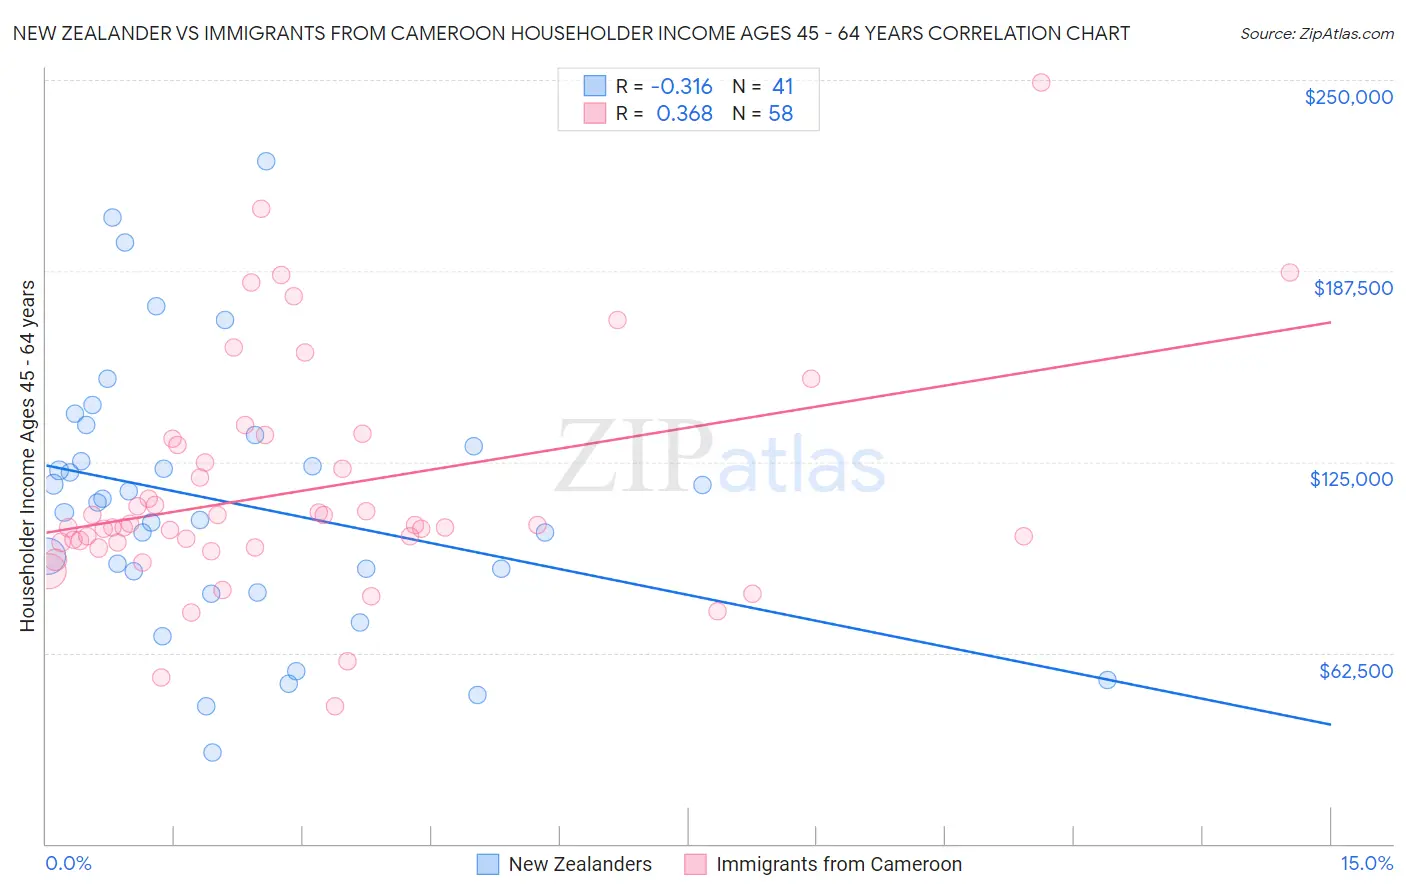
New Zealander vs Immigrants from Cameroon Householder Income Ages 45 - 64 years Correlation Chart
The statistical analysis conducted on geographies consisting of 106,839,275 people shows a mild negative correlation between the proportion of New Zealanders and household income with householder between the ages 45 and 64 in the United States with a correlation coefficient (R) of -0.316 and weighted average of $111,286. Similarly, the statistical analysis conducted on geographies consisting of 130,699,508 people shows a mild positive correlation between the proportion of Immigrants from Cameroon and household income with householder between the ages 45 and 64 in the United States with a correlation coefficient (R) of 0.368 and weighted average of $100,084, a difference of 11.2%.
Householder Income Ages 45 - 64 years Correlation Summary
| Measurement | New Zealander | Immigrants from Cameroon |
| Minimum | $29,688 | $45,128 |
| Maximum | $223,409 | $249,250 |
| Range | $193,721 | $204,122 |
| Mean | $111,423 | $115,608 |
| Median | $111,501 | $104,009 |
| Interquartile 25% (IQ1) | $85,594 | $98,639 |
| Interquartile 75% (IQ3) | $131,875 | $130,520 |
| Interquartile Range (IQR) | $46,281 | $31,881 |
| Standard Deviation (Sample) | $43,171 | $37,628 |
| Standard Deviation (Population) | $42,642 | $37,302 |
Similar Demographics by Householder Income Ages 45 - 64 years
Demographics Similar to New Zealanders by Householder Income Ages 45 - 64 years
In terms of householder income ages 45 - 64 years, the demographic groups most similar to New Zealanders are Immigrants from Belarus ($111,430, a difference of 0.13%), Immigrants from Latvia ($111,454, a difference of 0.15%), Laotian ($111,051, a difference of 0.21%), Mongolian ($111,602, a difference of 0.28%), and Immigrants from Norway ($111,669, a difference of 0.34%).
| Demographics | Rating | Rank | Householder Income Ages 45 - 64 years |
| Immigrants | Europe | 99.7 /100 | #59 | Exceptional $111,984 |
| Immigrants | Netherlands | 99.7 /100 | #60 | Exceptional $111,982 |
| Immigrants | Czechoslovakia | 99.7 /100 | #61 | Exceptional $111,914 |
| Immigrants | Norway | 99.7 /100 | #62 | Exceptional $111,669 |
| Mongolians | 99.6 /100 | #63 | Exceptional $111,602 |
| Immigrants | Latvia | 99.6 /100 | #64 | Exceptional $111,454 |
| Immigrants | Belarus | 99.6 /100 | #65 | Exceptional $111,430 |
| New Zealanders | 99.6 /100 | #66 | Exceptional $111,286 |
| Laotians | 99.5 /100 | #67 | Exceptional $111,051 |
| Immigrants | Romania | 99.4 /100 | #68 | Exceptional $110,633 |
| Immigrants | Italy | 99.4 /100 | #69 | Exceptional $110,434 |
| Koreans | 99.3 /100 | #70 | Exceptional $110,334 |
| Italians | 99.3 /100 | #71 | Exceptional $110,224 |
| Assyrians/Chaldeans/Syriacs | 99.3 /100 | #72 | Exceptional $110,201 |
| Argentineans | 99.3 /100 | #73 | Exceptional $110,103 |
Demographics Similar to Immigrants from Cameroon by Householder Income Ages 45 - 64 years
In terms of householder income ages 45 - 64 years, the demographic groups most similar to Immigrants from Cameroon are Belgian ($100,060, a difference of 0.020%), Aleut ($100,052, a difference of 0.030%), Moroccan ($100,138, a difference of 0.050%), Immigrants from Costa Rica ($100,141, a difference of 0.060%), and German ($100,224, a difference of 0.14%).
| Demographics | Rating | Rank | Householder Income Ages 45 - 64 years |
| South Americans | 56.4 /100 | #171 | Average $100,837 |
| Immigrants | Uzbekistan | 52.5 /100 | #172 | Average $100,523 |
| Alsatians | 51.4 /100 | #173 | Average $100,435 |
| Welsh | 50.0 /100 | #174 | Average $100,322 |
| Germans | 48.8 /100 | #175 | Average $100,224 |
| Immigrants | Costa Rica | 47.7 /100 | #176 | Average $100,141 |
| Moroccans | 47.7 /100 | #177 | Average $100,138 |
| Immigrants | Cameroon | 47.0 /100 | #178 | Average $100,084 |
| Belgians | 46.7 /100 | #179 | Average $100,060 |
| Aleuts | 46.6 /100 | #180 | Average $100,052 |
| Immigrants | Immigrants | 45.3 /100 | #181 | Average $99,943 |
| Finns | 44.8 /100 | #182 | Average $99,904 |
| Spaniards | 44.6 /100 | #183 | Average $99,889 |
| French | 43.8 /100 | #184 | Average $99,824 |
| Colombians | 43.2 /100 | #185 | Average $99,772 |