Nepalese vs Chickasaw Unemployment Among Ages 60 to 64 years
COMPARE
Nepalese
Chickasaw
Unemployment Among Ages 60 to 64 years
Unemployment Among Ages 60 to 64 years Comparison
Nepalese
Chickasaw
5.2%
UNEMPLOYMENT AMONG AGES 60 TO 64 YEARS
0.0/ 100
METRIC RATING
279th/ 347
METRIC RANK
4.3%
UNEMPLOYMENT AMONG AGES 60 TO 64 YEARS
100.0/ 100
METRIC RATING
13th/ 347
METRIC RANK
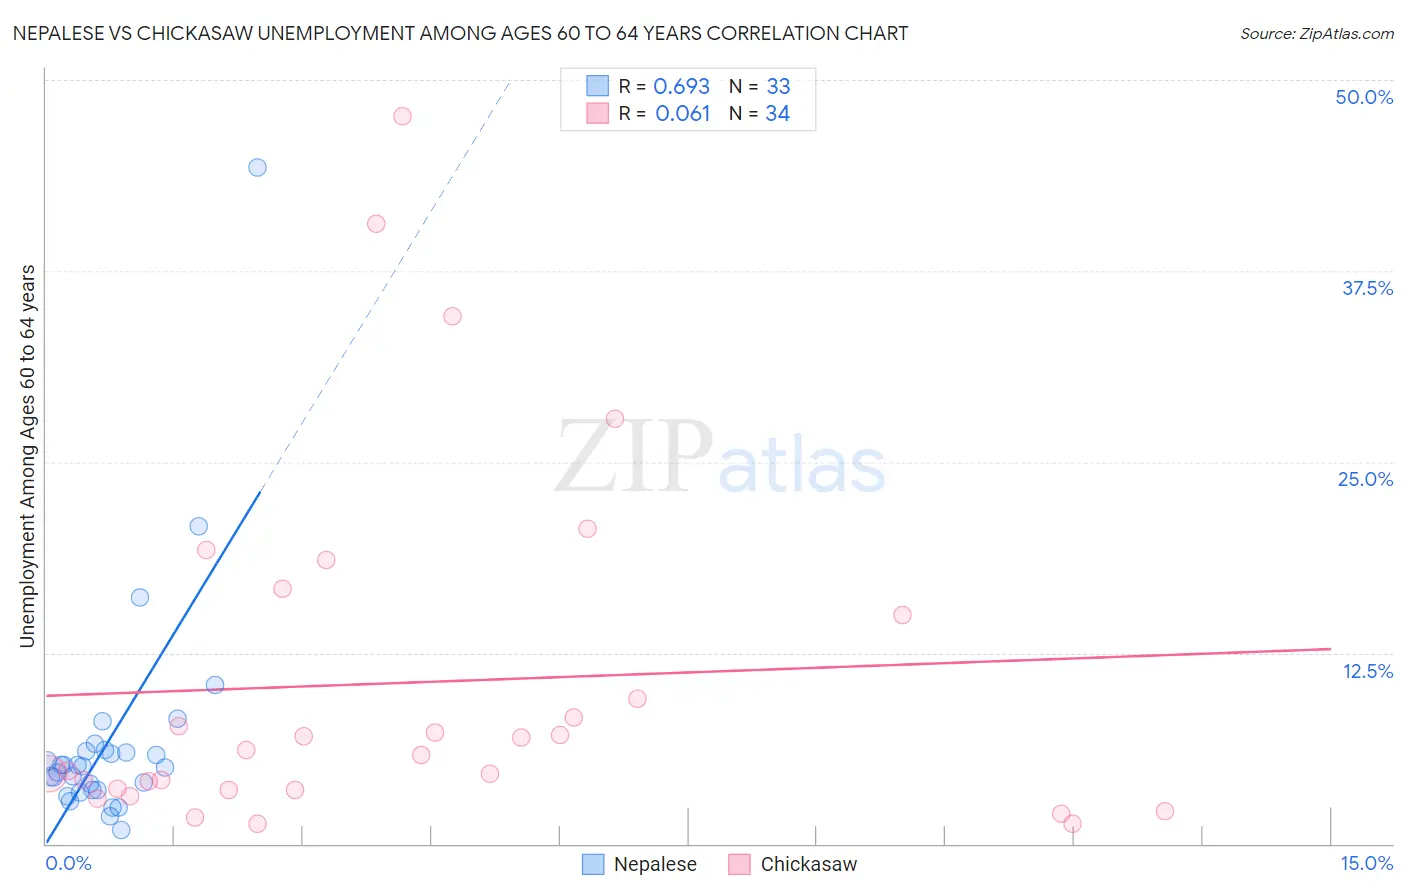
Nepalese vs Chickasaw Unemployment Among Ages 60 to 64 years Correlation Chart
The statistical analysis conducted on geographies consisting of 24,236,034 people shows a significant positive correlation between the proportion of Nepalese and unemployment rate among population between the ages 60 and 64 in the United States with a correlation coefficient (R) of 0.693 and weighted average of 5.2%. Similarly, the statistical analysis conducted on geographies consisting of 139,083,828 people shows a slight positive correlation between the proportion of Chickasaw and unemployment rate among population between the ages 60 and 64 in the United States with a correlation coefficient (R) of 0.061 and weighted average of 4.3%, a difference of 21.1%.
Unemployment Among Ages 60 to 64 years Correlation Summary
| Measurement | Nepalese | Chickasaw |
| Minimum | 0.90% | 1.3% |
| Maximum | 44.3% | 47.6% |
| Range | 43.4% | 46.3% |
| Mean | 6.8% | 10.5% |
| Median | 5.1% | 6.0% |
| Interquartile 25% (IQ1) | 3.5% | 3.5% |
| Interquartile 75% (IQ3) | 6.1% | 15.0% |
| Interquartile Range (IQR) | 2.6% | 11.5% |
| Standard Deviation (Sample) | 7.8% | 11.6% |
| Standard Deviation (Population) | 7.6% | 11.4% |
Similar Demographics by Unemployment Among Ages 60 to 64 years
Demographics Similar to Nepalese by Unemployment Among Ages 60 to 64 years
In terms of unemployment among ages 60 to 64 years, the demographic groups most similar to Nepalese are French American Indian (5.2%, a difference of 0.010%), Immigrants from Haiti (5.2%, a difference of 0.050%), Mexican (5.2%, a difference of 0.050%), Guatemalan (5.2%, a difference of 0.20%), and Immigrants from Guatemala (5.3%, a difference of 0.49%).
| Demographics | Rating | Rank | Unemployment Among Ages 60 to 64 years |
| Haitians | 0.1 /100 | #272 | Tragic 5.2% |
| Immigrants | Spain | 0.1 /100 | #273 | Tragic 5.2% |
| Hopi | 0.1 /100 | #274 | Tragic 5.2% |
| Immigrants | Hong Kong | 0.1 /100 | #275 | Tragic 5.2% |
| Central Americans | 0.0 /100 | #276 | Tragic 5.2% |
| Immigrants | Caribbean | 0.0 /100 | #277 | Tragic 5.2% |
| Guatemalans | 0.0 /100 | #278 | Tragic 5.2% |
| Nepalese | 0.0 /100 | #279 | Tragic 5.2% |
| French American Indians | 0.0 /100 | #280 | Tragic 5.2% |
| Immigrants | Haiti | 0.0 /100 | #281 | Tragic 5.2% |
| Mexicans | 0.0 /100 | #282 | Tragic 5.2% |
| Immigrants | Guatemala | 0.0 /100 | #283 | Tragic 5.3% |
| Taiwanese | 0.0 /100 | #284 | Tragic 5.3% |
| West Indians | 0.0 /100 | #285 | Tragic 5.3% |
| Mexican American Indians | 0.0 /100 | #286 | Tragic 5.3% |
Demographics Similar to Chickasaw by Unemployment Among Ages 60 to 64 years
In terms of unemployment among ages 60 to 64 years, the demographic groups most similar to Chickasaw are Immigrants from Cuba (4.3%, a difference of 0.050%), Norwegian (4.3%, a difference of 0.050%), Sudanese (4.3%, a difference of 0.55%), Danish (4.4%, a difference of 0.81%), and Immigrants from Afghanistan (4.4%, a difference of 0.97%).
| Demographics | Rating | Rank | Unemployment Among Ages 60 to 64 years |
| Immigrants | Congo | 100.0 /100 | #6 | Exceptional 4.1% |
| Lumbee | 100.0 /100 | #7 | Exceptional 4.2% |
| Immigrants | Micronesia | 100.0 /100 | #8 | Exceptional 4.2% |
| Indonesians | 100.0 /100 | #9 | Exceptional 4.2% |
| Immigrants | Bosnia and Herzegovina | 100.0 /100 | #10 | Exceptional 4.2% |
| Luxembourgers | 100.0 /100 | #11 | Exceptional 4.3% |
| Immigrants | Cuba | 100.0 /100 | #12 | Exceptional 4.3% |
| Chickasaw | 100.0 /100 | #13 | Exceptional 4.3% |
| Norwegians | 100.0 /100 | #14 | Exceptional 4.3% |
| Sudanese | 100.0 /100 | #15 | Exceptional 4.3% |
| Danes | 100.0 /100 | #16 | Exceptional 4.4% |
| Immigrants | Afghanistan | 100.0 /100 | #17 | Exceptional 4.4% |
| Slovenes | 100.0 /100 | #18 | Exceptional 4.4% |
| Tsimshian | 100.0 /100 | #19 | Exceptional 4.4% |
| Afghans | 100.0 /100 | #20 | Exceptional 4.4% |