Navajo vs Swiss No Vehicles in Household
COMPARE
Navajo
Swiss
No Vehicles in Household
No Vehicles in Household Comparison
Navajo
Swiss
9.4%
NO VEHICLES IN HOUSEHOLD
94.2/ 100
METRIC RATING
115th/ 347
METRIC RANK
7.9%
NO VEHICLES IN HOUSEHOLD
99.9/ 100
METRIC RATING
42nd/ 347
METRIC RANK
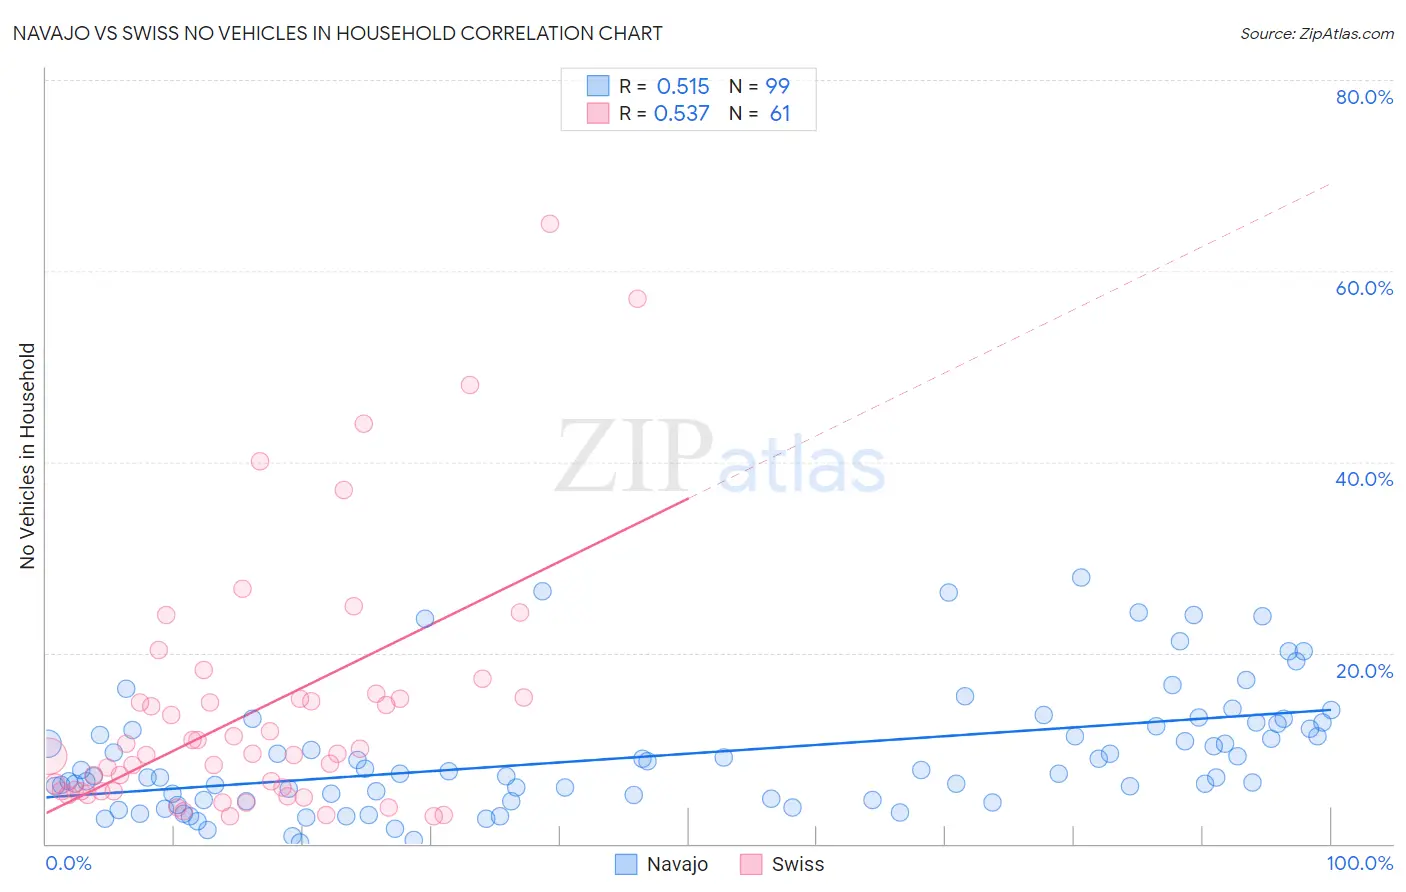
Navajo vs Swiss No Vehicles in Household Correlation Chart
The statistical analysis conducted on geographies consisting of 224,409,454 people shows a substantial positive correlation between the proportion of Navajo and percentage of households with no vehicle available in the United States with a correlation coefficient (R) of 0.515 and weighted average of 9.4%. Similarly, the statistical analysis conducted on geographies consisting of 462,788,069 people shows a substantial positive correlation between the proportion of Swiss and percentage of households with no vehicle available in the United States with a correlation coefficient (R) of 0.537 and weighted average of 7.9%, a difference of 20.0%.
No Vehicles in Household Correlation Summary
| Measurement | Navajo | Swiss |
| Minimum | 0.12% | 2.8% |
| Maximum | 27.9% | 65.0% |
| Range | 27.8% | 62.2% |
| Mean | 9.3% | 14.0% |
| Median | 7.4% | 9.4% |
| Interquartile 25% (IQ1) | 4.6% | 5.5% |
| Interquartile 75% (IQ3) | 12.3% | 15.2% |
| Interquartile Range (IQR) | 7.8% | 9.7% |
| Standard Deviation (Sample) | 6.3% | 13.3% |
| Standard Deviation (Population) | 6.3% | 13.1% |
Similar Demographics by No Vehicles in Household
Demographics Similar to Navajo by No Vehicles in Household
In terms of no vehicles in household, the demographic groups most similar to Navajo are Serbian (9.4%, a difference of 0.070%), Japanese (9.4%, a difference of 0.070%), Chippewa (9.4%, a difference of 0.24%), Immigrants from Netherlands (9.4%, a difference of 0.49%), and Armenian (9.4%, a difference of 0.59%).
| Demographics | Rating | Rank | No Vehicles in Household |
| Mexican American Indians | 97.6 /100 | #108 | Exceptional 9.1% |
| Maltese | 97.6 /100 | #109 | Exceptional 9.1% |
| Delaware | 97.2 /100 | #110 | Exceptional 9.2% |
| Immigrants | Kuwait | 95.1 /100 | #111 | Exceptional 9.4% |
| Armenians | 95.0 /100 | #112 | Exceptional 9.4% |
| Immigrants | Netherlands | 94.8 /100 | #113 | Exceptional 9.4% |
| Serbians | 94.3 /100 | #114 | Exceptional 9.4% |
| Navajo | 94.2 /100 | #115 | Exceptional 9.4% |
| Japanese | 94.1 /100 | #116 | Exceptional 9.4% |
| Chippewa | 93.8 /100 | #117 | Exceptional 9.4% |
| Greeks | 92.9 /100 | #118 | Exceptional 9.5% |
| Fijians | 92.7 /100 | #119 | Exceptional 9.5% |
| Immigrants | Thailand | 92.6 /100 | #120 | Exceptional 9.5% |
| Puget Sound Salish | 92.4 /100 | #121 | Exceptional 9.5% |
| Costa Ricans | 92.3 /100 | #122 | Exceptional 9.5% |
Demographics Similar to Swiss by No Vehicles in Household
In terms of no vehicles in household, the demographic groups most similar to Swiss are Chickasaw (7.9%, a difference of 0.080%), French Canadian (7.8%, a difference of 0.14%), Czechoslovakian (7.8%, a difference of 0.28%), Immigrants from Fiji (7.8%, a difference of 0.38%), and Choctaw (7.9%, a difference of 0.44%).
| Demographics | Rating | Rank | No Vehicles in Household |
| Cherokee | 99.9 /100 | #35 | Exceptional 7.7% |
| Iraqis | 99.9 /100 | #36 | Exceptional 7.7% |
| Basques | 99.9 /100 | #37 | Exceptional 7.8% |
| Creek | 99.9 /100 | #38 | Exceptional 7.8% |
| Immigrants | Fiji | 99.9 /100 | #39 | Exceptional 7.8% |
| Czechoslovakians | 99.9 /100 | #40 | Exceptional 7.8% |
| French Canadians | 99.9 /100 | #41 | Exceptional 7.8% |
| Swiss | 99.9 /100 | #42 | Exceptional 7.9% |
| Chickasaw | 99.9 /100 | #43 | Exceptional 7.9% |
| Choctaw | 99.9 /100 | #44 | Exceptional 7.9% |
| Immigrants | Nonimmigrants | 99.9 /100 | #45 | Exceptional 7.9% |
| Spanish | 99.9 /100 | #46 | Exceptional 7.9% |
| Northern Europeans | 99.9 /100 | #47 | Exceptional 7.9% |
| Afghans | 99.9 /100 | #48 | Exceptional 8.0% |
| Guamanians/Chamorros | 99.9 /100 | #49 | Exceptional 8.0% |