Navajo vs Immigrants from China No Vehicles in Household
COMPARE
Navajo
Immigrants from China
No Vehicles in Household
No Vehicles in Household Comparison
Navajo
Immigrants from China
9.4%
NO VEHICLES IN HOUSEHOLD
94.2/ 100
METRIC RATING
115th/ 347
METRIC RANK
15.2%
NO VEHICLES IN HOUSEHOLD
0.0/ 100
METRIC RATING
305th/ 347
METRIC RANK
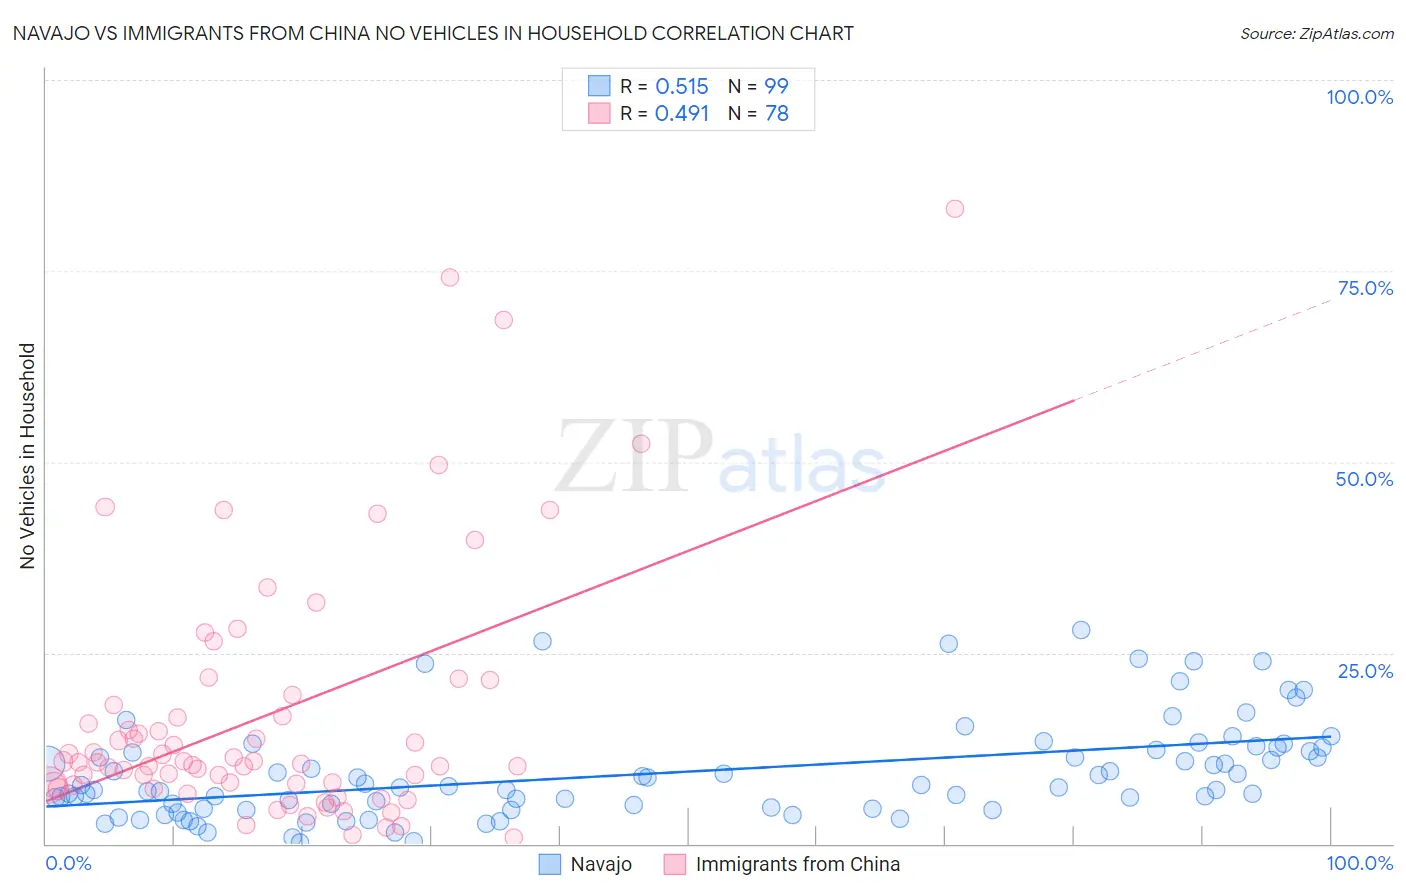
Navajo vs Immigrants from China No Vehicles in Household Correlation Chart
The statistical analysis conducted on geographies consisting of 224,409,454 people shows a substantial positive correlation between the proportion of Navajo and percentage of households with no vehicle available in the United States with a correlation coefficient (R) of 0.515 and weighted average of 9.4%. Similarly, the statistical analysis conducted on geographies consisting of 455,244,510 people shows a moderate positive correlation between the proportion of Immigrants from China and percentage of households with no vehicle available in the United States with a correlation coefficient (R) of 0.491 and weighted average of 15.2%, a difference of 60.8%.
No Vehicles in Household Correlation Summary
| Measurement | Navajo | Immigrants from China |
| Minimum | 0.12% | 0.81% |
| Maximum | 27.9% | 83.2% |
| Range | 27.8% | 82.4% |
| Mean | 9.3% | 16.9% |
| Median | 7.4% | 10.7% |
| Interquartile 25% (IQ1) | 4.6% | 7.7% |
| Interquartile 75% (IQ3) | 12.3% | 18.2% |
| Interquartile Range (IQR) | 7.8% | 10.5% |
| Standard Deviation (Sample) | 6.3% | 16.7% |
| Standard Deviation (Population) | 6.3% | 16.6% |
Similar Demographics by No Vehicles in Household
Demographics Similar to Navajo by No Vehicles in Household
In terms of no vehicles in household, the demographic groups most similar to Navajo are Serbian (9.4%, a difference of 0.070%), Japanese (9.4%, a difference of 0.070%), Chippewa (9.4%, a difference of 0.24%), Immigrants from Netherlands (9.4%, a difference of 0.49%), and Armenian (9.4%, a difference of 0.59%).
| Demographics | Rating | Rank | No Vehicles in Household |
| Mexican American Indians | 97.6 /100 | #108 | Exceptional 9.1% |
| Maltese | 97.6 /100 | #109 | Exceptional 9.1% |
| Delaware | 97.2 /100 | #110 | Exceptional 9.2% |
| Immigrants | Kuwait | 95.1 /100 | #111 | Exceptional 9.4% |
| Armenians | 95.0 /100 | #112 | Exceptional 9.4% |
| Immigrants | Netherlands | 94.8 /100 | #113 | Exceptional 9.4% |
| Serbians | 94.3 /100 | #114 | Exceptional 9.4% |
| Navajo | 94.2 /100 | #115 | Exceptional 9.4% |
| Japanese | 94.1 /100 | #116 | Exceptional 9.4% |
| Chippewa | 93.8 /100 | #117 | Exceptional 9.4% |
| Greeks | 92.9 /100 | #118 | Exceptional 9.5% |
| Fijians | 92.7 /100 | #119 | Exceptional 9.5% |
| Immigrants | Thailand | 92.6 /100 | #120 | Exceptional 9.5% |
| Puget Sound Salish | 92.4 /100 | #121 | Exceptional 9.5% |
| Costa Ricans | 92.3 /100 | #122 | Exceptional 9.5% |
Demographics Similar to Immigrants from China by No Vehicles in Household
In terms of no vehicles in household, the demographic groups most similar to Immigrants from China are Immigrants from Russia (15.1%, a difference of 0.38%), Immigrants from Western Africa (15.0%, a difference of 1.0%), Immigrants from Belize (15.4%, a difference of 1.3%), Immigrants from Haiti (15.4%, a difference of 1.5%), and U.S. Virgin Islander (15.4%, a difference of 1.5%).
| Demographics | Rating | Rank | No Vehicles in Household |
| Moroccans | 0.0 /100 | #298 | Tragic 14.7% |
| Immigrants | Greece | 0.0 /100 | #299 | Tragic 14.7% |
| Yuman | 0.0 /100 | #300 | Tragic 14.9% |
| Immigrants | Ukraine | 0.0 /100 | #301 | Tragic 14.9% |
| Haitians | 0.0 /100 | #302 | Tragic 14.9% |
| Immigrants | Western Africa | 0.0 /100 | #303 | Tragic 15.0% |
| Immigrants | Russia | 0.0 /100 | #304 | Tragic 15.1% |
| Immigrants | China | 0.0 /100 | #305 | Tragic 15.2% |
| Immigrants | Belize | 0.0 /100 | #306 | Tragic 15.4% |
| Immigrants | Haiti | 0.0 /100 | #307 | Tragic 15.4% |
| U.S. Virgin Islanders | 0.0 /100 | #308 | Tragic 15.4% |
| Puerto Ricans | 0.0 /100 | #309 | Tragic 15.5% |
| Cape Verdeans | 0.0 /100 | #310 | Tragic 15.6% |
| Immigrants | Israel | 0.0 /100 | #311 | Tragic 15.6% |
| Alaskan Athabascans | 0.0 /100 | #312 | Tragic 15.6% |