Carpatho Rusyn vs Swiss No Vehicles in Household
COMPARE
Carpatho Rusyn
Swiss
No Vehicles in Household
No Vehicles in Household Comparison
Carpatho Rusyns
Swiss
10.7%
NO VEHICLES IN HOUSEHOLD
32.1/ 100
METRIC RATING
192nd/ 347
METRIC RANK
7.9%
NO VEHICLES IN HOUSEHOLD
99.9/ 100
METRIC RATING
42nd/ 347
METRIC RANK
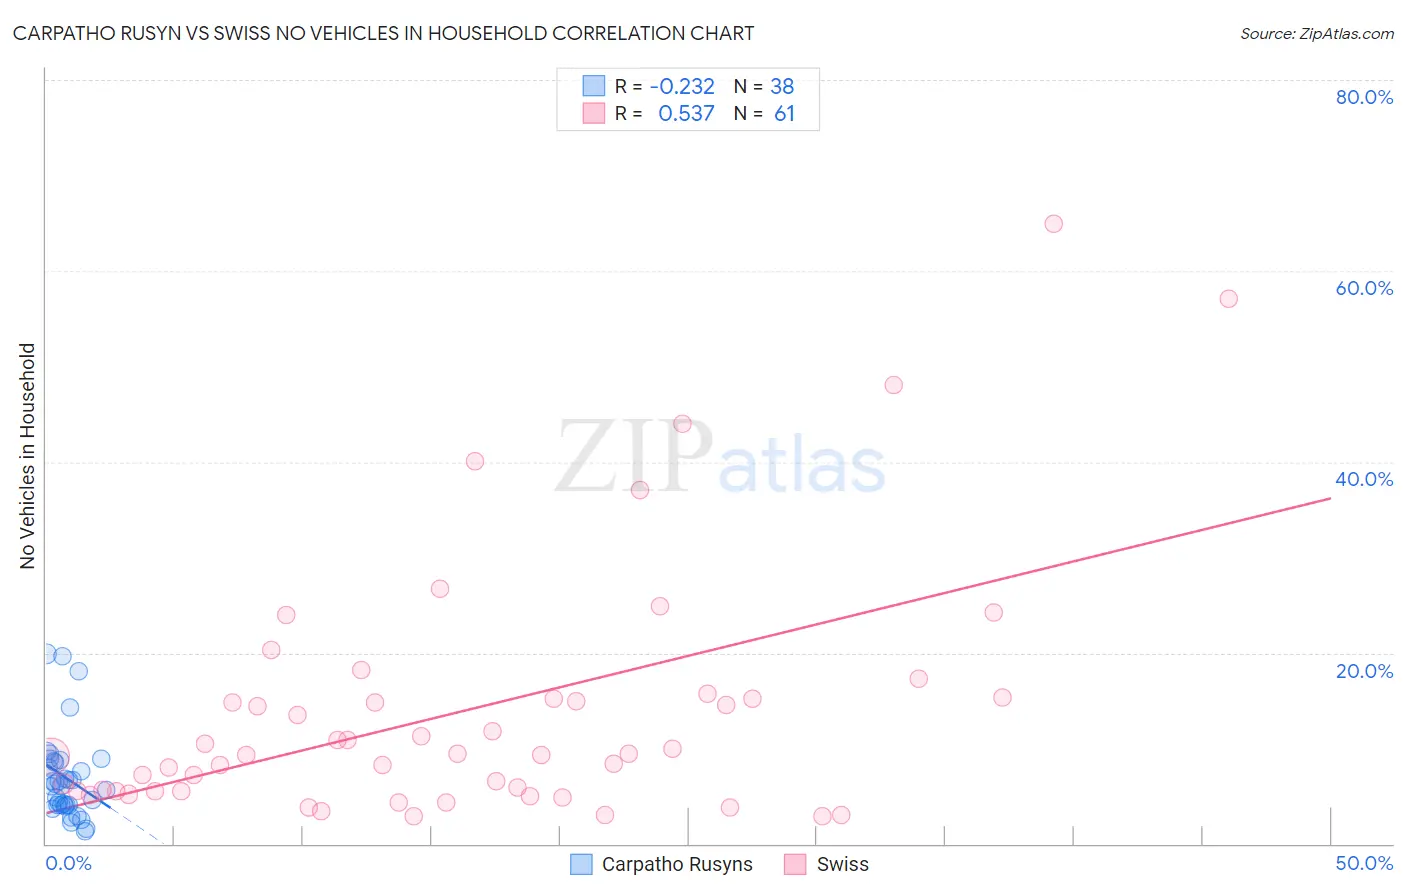
Carpatho Rusyn vs Swiss No Vehicles in Household Correlation Chart
The statistical analysis conducted on geographies consisting of 58,857,329 people shows a weak negative correlation between the proportion of Carpatho Rusyns and percentage of households with no vehicle available in the United States with a correlation coefficient (R) of -0.232 and weighted average of 10.7%. Similarly, the statistical analysis conducted on geographies consisting of 462,788,069 people shows a substantial positive correlation between the proportion of Swiss and percentage of households with no vehicle available in the United States with a correlation coefficient (R) of 0.537 and weighted average of 7.9%, a difference of 35.9%.
No Vehicles in Household Correlation Summary
| Measurement | Carpatho Rusyn | Swiss |
| Minimum | 1.3% | 2.8% |
| Maximum | 19.8% | 65.0% |
| Range | 18.5% | 62.2% |
| Mean | 6.9% | 14.0% |
| Median | 6.2% | 9.4% |
| Interquartile 25% (IQ1) | 4.0% | 5.5% |
| Interquartile 75% (IQ3) | 8.6% | 15.2% |
| Interquartile Range (IQR) | 4.6% | 9.7% |
| Standard Deviation (Sample) | 4.5% | 13.3% |
| Standard Deviation (Population) | 4.5% | 13.1% |
Similar Demographics by No Vehicles in Household
Demographics Similar to Carpatho Rusyns by No Vehicles in Household
In terms of no vehicles in household, the demographic groups most similar to Carpatho Rusyns are Immigrants from Northern Europe (10.7%, a difference of 0.14%), Immigrants from North Macedonia (10.6%, a difference of 0.38%), Immigrants from Eritrea (10.6%, a difference of 0.61%), Ukrainian (10.7%, a difference of 0.64%), and Immigrants from Armenia (10.6%, a difference of 0.79%).
| Demographics | Rating | Rank | No Vehicles in Household |
| South Americans | 41.9 /100 | #185 | Average 10.5% |
| German Russians | 40.6 /100 | #186 | Average 10.5% |
| Immigrants | Poland | 38.4 /100 | #187 | Fair 10.6% |
| Immigrants | Armenia | 37.5 /100 | #188 | Fair 10.6% |
| Immigrants | Eritrea | 36.3 /100 | #189 | Fair 10.6% |
| Immigrants | North Macedonia | 34.6 /100 | #190 | Fair 10.6% |
| Immigrants | Northern Europe | 33.1 /100 | #191 | Fair 10.7% |
| Carpatho Rusyns | 32.1 /100 | #192 | Fair 10.7% |
| Ukrainians | 28.0 /100 | #193 | Fair 10.7% |
| Pueblo | 27.0 /100 | #194 | Fair 10.8% |
| Immigrants | Brazil | 26.3 /100 | #195 | Fair 10.8% |
| Central Americans | 24.3 /100 | #196 | Fair 10.8% |
| Shoshone | 24.1 /100 | #197 | Fair 10.8% |
| Immigrants | Sweden | 22.9 /100 | #198 | Fair 10.8% |
| Immigrants | Asia | 21.3 /100 | #199 | Fair 10.9% |
Demographics Similar to Swiss by No Vehicles in Household
In terms of no vehicles in household, the demographic groups most similar to Swiss are Chickasaw (7.9%, a difference of 0.080%), French Canadian (7.8%, a difference of 0.14%), Czechoslovakian (7.8%, a difference of 0.28%), Immigrants from Fiji (7.8%, a difference of 0.38%), and Choctaw (7.9%, a difference of 0.44%).
| Demographics | Rating | Rank | No Vehicles in Household |
| Cherokee | 99.9 /100 | #35 | Exceptional 7.7% |
| Iraqis | 99.9 /100 | #36 | Exceptional 7.7% |
| Basques | 99.9 /100 | #37 | Exceptional 7.8% |
| Creek | 99.9 /100 | #38 | Exceptional 7.8% |
| Immigrants | Fiji | 99.9 /100 | #39 | Exceptional 7.8% |
| Czechoslovakians | 99.9 /100 | #40 | Exceptional 7.8% |
| French Canadians | 99.9 /100 | #41 | Exceptional 7.8% |
| Swiss | 99.9 /100 | #42 | Exceptional 7.9% |
| Chickasaw | 99.9 /100 | #43 | Exceptional 7.9% |
| Choctaw | 99.9 /100 | #44 | Exceptional 7.9% |
| Immigrants | Nonimmigrants | 99.9 /100 | #45 | Exceptional 7.9% |
| Spanish | 99.9 /100 | #46 | Exceptional 7.9% |
| Northern Europeans | 99.9 /100 | #47 | Exceptional 7.9% |
| Afghans | 99.9 /100 | #48 | Exceptional 8.0% |
| Guamanians/Chamorros | 99.9 /100 | #49 | Exceptional 8.0% |