Navajo vs Immigrants from Ukraine Unemployment Among Ages 20 to 24 years
COMPARE
Navajo
Immigrants from Ukraine
Unemployment Among Ages 20 to 24 years
Unemployment Among Ages 20 to 24 years Comparison
Navajo
Immigrants from Ukraine
16.1%
UNEMPLOYMENT AMONG AGES 20 TO 24 YEARS
0.0/ 100
METRIC RATING
341st/ 347
METRIC RANK
10.6%
UNEMPLOYMENT AMONG AGES 20 TO 24 YEARS
3.3/ 100
METRIC RATING
235th/ 347
METRIC RANK
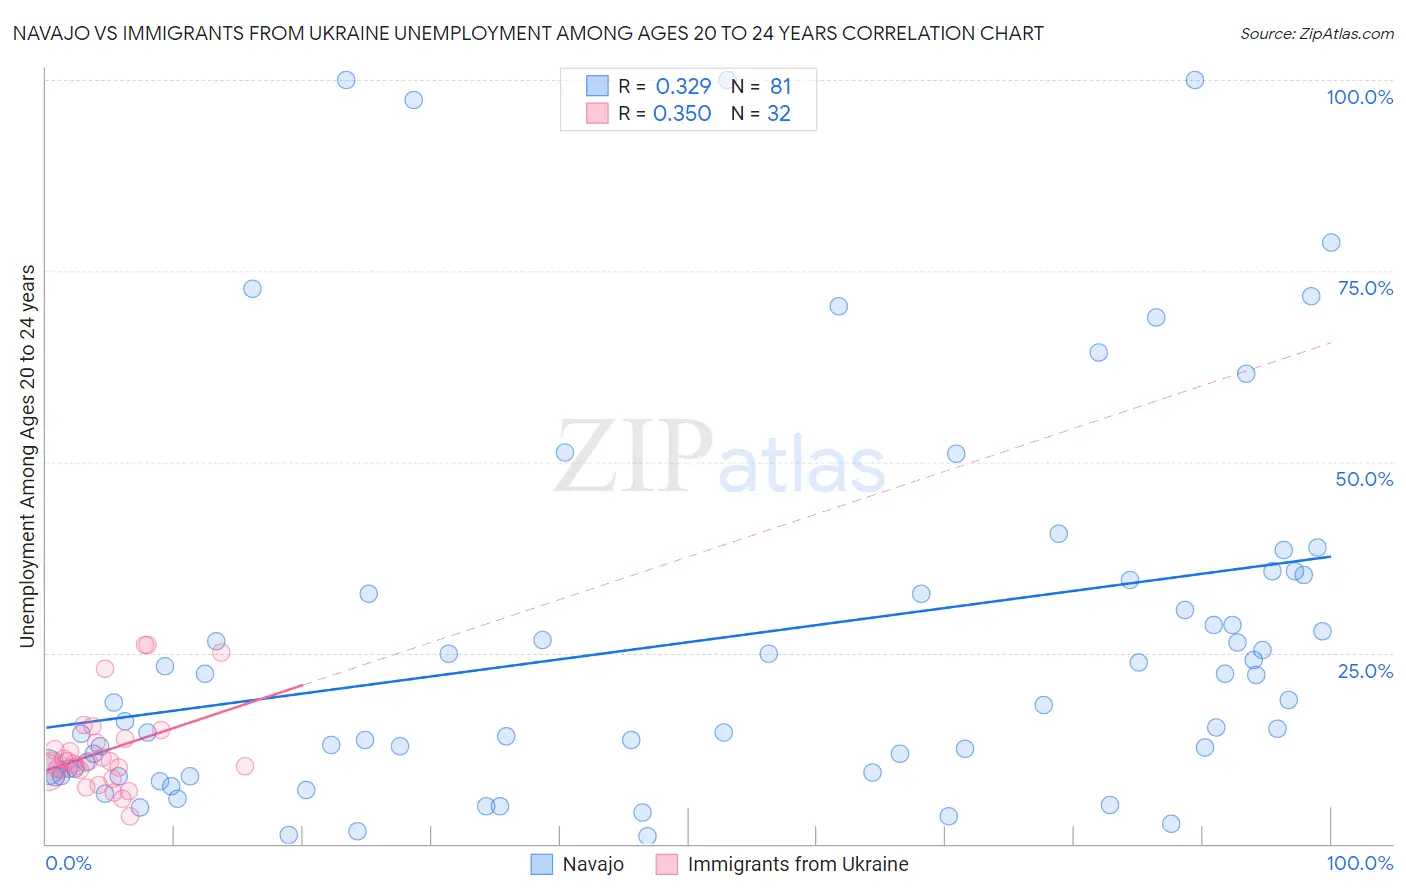
Navajo vs Immigrants from Ukraine Unemployment Among Ages 20 to 24 years Correlation Chart
The statistical analysis conducted on geographies consisting of 220,371,220 people shows a mild positive correlation between the proportion of Navajo and unemployment rate among population between the ages 20 and 24 in the United States with a correlation coefficient (R) of 0.329 and weighted average of 16.1%. Similarly, the statistical analysis conducted on geographies consisting of 283,499,162 people shows a mild positive correlation between the proportion of Immigrants from Ukraine and unemployment rate among population between the ages 20 and 24 in the United States with a correlation coefficient (R) of 0.350 and weighted average of 10.6%, a difference of 51.9%.
Unemployment Among Ages 20 to 24 years Correlation Summary
| Measurement | Navajo | Immigrants from Ukraine |
| Minimum | 1.0% | 3.6% |
| Maximum | 100.0% | 26.0% |
| Range | 99.0% | 22.4% |
| Mean | 26.5% | 12.1% |
| Median | 18.1% | 10.7% |
| Interquartile 25% (IQ1) | 9.6% | 9.5% |
| Interquartile 75% (IQ3) | 33.7% | 13.5% |
| Interquartile Range (IQR) | 24.1% | 4.1% |
| Standard Deviation (Sample) | 24.9% | 5.6% |
| Standard Deviation (Population) | 24.7% | 5.5% |
Similar Demographics by Unemployment Among Ages 20 to 24 years
Demographics Similar to Navajo by Unemployment Among Ages 20 to 24 years
In terms of unemployment among ages 20 to 24 years, the demographic groups most similar to Navajo are Yuman (15.8%, a difference of 1.9%), Puerto Rican (16.7%, a difference of 3.2%), Immigrants from Yemen (14.9%, a difference of 8.4%), Tsimshian (18.0%, a difference of 11.4%), and Immigrants from St. Vincent and the Grenadines (14.3%, a difference of 12.5%).
| Demographics | Rating | Rank | Unemployment Among Ages 20 to 24 years |
| Immigrants | Guyana | 0.0 /100 | #333 | Tragic 13.9% |
| Guyanese | 0.0 /100 | #334 | Tragic 14.0% |
| Sioux | 0.0 /100 | #335 | Tragic 14.2% |
| Pima | 0.0 /100 | #336 | Tragic 14.2% |
| Paiute | 0.0 /100 | #337 | Tragic 14.3% |
| Immigrants | St. Vincent and the Grenadines | 0.0 /100 | #338 | Tragic 14.3% |
| Immigrants | Yemen | 0.0 /100 | #339 | Tragic 14.9% |
| Yuman | 0.0 /100 | #340 | Tragic 15.8% |
| Navajo | 0.0 /100 | #341 | Tragic 16.1% |
| Puerto Ricans | 0.0 /100 | #342 | Tragic 16.7% |
| Tsimshian | 0.0 /100 | #343 | Tragic 18.0% |
| Crow | 0.0 /100 | #344 | Tragic 18.7% |
| Hopi | 0.0 /100 | #345 | Tragic 19.9% |
| Yup'ik | 0.0 /100 | #346 | Tragic 20.9% |
| Inupiat | 0.0 /100 | #347 | Tragic 20.9% |
Demographics Similar to Immigrants from Ukraine by Unemployment Among Ages 20 to 24 years
In terms of unemployment among ages 20 to 24 years, the demographic groups most similar to Immigrants from Ukraine are Mexican (10.6%, a difference of 0.040%), Immigrants from Africa (10.6%, a difference of 0.050%), Choctaw (10.6%, a difference of 0.060%), Israeli (10.6%, a difference of 0.090%), and Native Hawaiian (10.6%, a difference of 0.14%).
| Demographics | Rating | Rank | Unemployment Among Ages 20 to 24 years |
| Mexican American Indians | 4.6 /100 | #228 | Tragic 10.6% |
| Americans | 4.4 /100 | #229 | Tragic 10.6% |
| French American Indians | 4.1 /100 | #230 | Tragic 10.6% |
| Native Hawaiians | 3.9 /100 | #231 | Tragic 10.6% |
| Israelis | 3.7 /100 | #232 | Tragic 10.6% |
| Choctaw | 3.6 /100 | #233 | Tragic 10.6% |
| Immigrants | Africa | 3.5 /100 | #234 | Tragic 10.6% |
| Immigrants | Ukraine | 3.3 /100 | #235 | Tragic 10.6% |
| Mexicans | 3.2 /100 | #236 | Tragic 10.6% |
| Immigrants | Immigrants | 2.7 /100 | #237 | Tragic 10.6% |
| Immigrants | Pakistan | 2.6 /100 | #238 | Tragic 10.6% |
| Salvadorans | 2.4 /100 | #239 | Tragic 10.7% |
| Immigrants | Central America | 2.0 /100 | #240 | Tragic 10.7% |
| Immigrants | El Salvador | 1.7 /100 | #241 | Tragic 10.7% |
| Moroccans | 1.4 /100 | #242 | Tragic 10.7% |