Navajo vs Immigrants from Ukraine 8th Grade
COMPARE
Navajo
Immigrants from Ukraine
8th Grade
8th Grade Comparison
Navajo
Immigrants from Ukraine
95.3%
8TH GRADE
5.7/ 100
METRIC RATING
226th/ 347
METRIC RANK
95.8%
8TH GRADE
59.5/ 100
METRIC RATING
168th/ 347
METRIC RANK
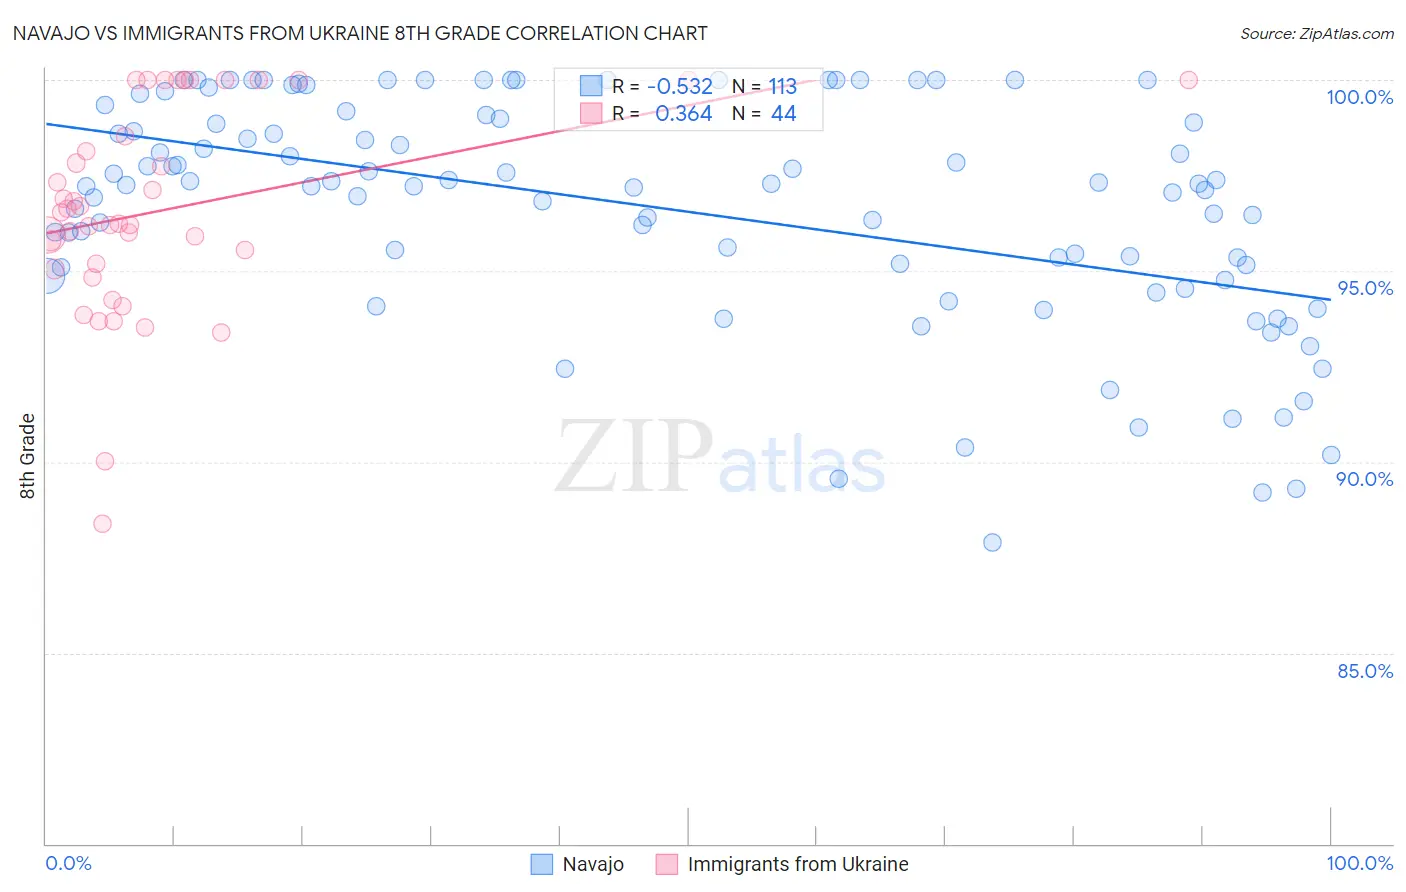
Navajo vs Immigrants from Ukraine 8th Grade Correlation Chart
The statistical analysis conducted on geographies consisting of 224,871,905 people shows a substantial negative correlation between the proportion of Navajo and percentage of population with at least 8th grade education in the United States with a correlation coefficient (R) of -0.532 and weighted average of 95.3%. Similarly, the statistical analysis conducted on geographies consisting of 289,712,791 people shows a mild positive correlation between the proportion of Immigrants from Ukraine and percentage of population with at least 8th grade education in the United States with a correlation coefficient (R) of 0.364 and weighted average of 95.8%, a difference of 0.52%.
8th Grade Correlation Summary
| Measurement | Navajo | Immigrants from Ukraine |
| Minimum | 87.9% | 88.4% |
| Maximum | 100.0% | 100.0% |
| Range | 12.1% | 11.6% |
| Mean | 96.6% | 96.6% |
| Median | 97.3% | 96.4% |
| Interquartile 25% (IQ1) | 95.0% | 95.1% |
| Interquartile 75% (IQ3) | 99.0% | 99.3% |
| Interquartile Range (IQR) | 4.0% | 4.2% |
| Standard Deviation (Sample) | 2.9% | 2.7% |
| Standard Deviation (Population) | 2.9% | 2.7% |
Similar Demographics by 8th Grade
Demographics Similar to Navajo by 8th Grade
In terms of 8th grade, the demographic groups most similar to Navajo are Bahamian (95.3%, a difference of 0.0%), Immigrants from Western Asia (95.3%, a difference of 0.010%), Subsaharan African (95.3%, a difference of 0.010%), Immigrants from Eastern Africa (95.3%, a difference of 0.010%), and Immigrants from Malaysia (95.3%, a difference of 0.040%).
| Demographics | Rating | Rank | 8th Grade |
| Spanish Americans | 8.0 /100 | #219 | Tragic 95.4% |
| Immigrants | Southern Europe | 7.7 /100 | #220 | Tragic 95.3% |
| Immigrants | Syria | 7.4 /100 | #221 | Tragic 95.3% |
| Immigrants | Malaysia | 7.3 /100 | #222 | Tragic 95.3% |
| Immigrants | Oceania | 7.1 /100 | #223 | Tragic 95.3% |
| Immigrants | Western Asia | 6.0 /100 | #224 | Tragic 95.3% |
| Sub-Saharan Africans | 6.0 /100 | #225 | Tragic 95.3% |
| Navajo | 5.7 /100 | #226 | Tragic 95.3% |
| Bahamians | 5.6 /100 | #227 | Tragic 95.3% |
| Immigrants | Eastern Africa | 5.6 /100 | #228 | Tragic 95.3% |
| Immigrants | Indonesia | 4.4 /100 | #229 | Tragic 95.3% |
| Immigrants | Panama | 4.1 /100 | #230 | Tragic 95.2% |
| Asians | 3.5 /100 | #231 | Tragic 95.2% |
| Indians (Asian) | 3.3 /100 | #232 | Tragic 95.2% |
| Immigrants | Asia | 3.1 /100 | #233 | Tragic 95.2% |
Demographics Similar to Immigrants from Ukraine by 8th Grade
In terms of 8th grade, the demographic groups most similar to Immigrants from Ukraine are Spaniard (95.8%, a difference of 0.0%), Alsatian (95.8%, a difference of 0.010%), Immigrants from Poland (95.8%, a difference of 0.010%), Immigrants from Iran (95.8%, a difference of 0.010%), and Ute (95.8%, a difference of 0.010%).
| Demographics | Rating | Rank | 8th Grade |
| Bermudans | 67.5 /100 | #161 | Good 95.8% |
| Immigrants | Kenya | 67.2 /100 | #162 | Good 95.8% |
| Immigrants | Sri Lanka | 64.1 /100 | #163 | Good 95.8% |
| Immigrants | Italy | 63.5 /100 | #164 | Good 95.8% |
| Alsatians | 61.4 /100 | #165 | Good 95.8% |
| Immigrants | Poland | 61.1 /100 | #166 | Good 95.8% |
| Spaniards | 60.0 /100 | #167 | Good 95.8% |
| Immigrants | Ukraine | 59.5 /100 | #168 | Average 95.8% |
| Immigrants | Iran | 58.6 /100 | #169 | Average 95.8% |
| Ute | 58.5 /100 | #170 | Average 95.8% |
| Egyptians | 58.2 /100 | #171 | Average 95.8% |
| Immigrants | Korea | 57.9 /100 | #172 | Average 95.8% |
| Mongolians | 53.0 /100 | #173 | Average 95.8% |
| Chileans | 50.0 /100 | #174 | Average 95.7% |
| Immigrants | Albania | 49.6 /100 | #175 | Average 95.7% |