Immigrants from Hungary vs Jamaican 2 or more Vehicles in Household
COMPARE
Immigrants from Hungary
Jamaican
2 or more Vehicles in Household
2 or more Vehicles in Household Comparison
Immigrants from Hungary
Jamaicans
54.2%
2 OR MORE VEHICLES IN HOUSEHOLD
11.3/ 100
METRIC RATING
211th/ 347
METRIC RANK
45.8%
2 OR MORE VEHICLES IN HOUSEHOLD
0.0/ 100
METRIC RATING
319th/ 347
METRIC RANK
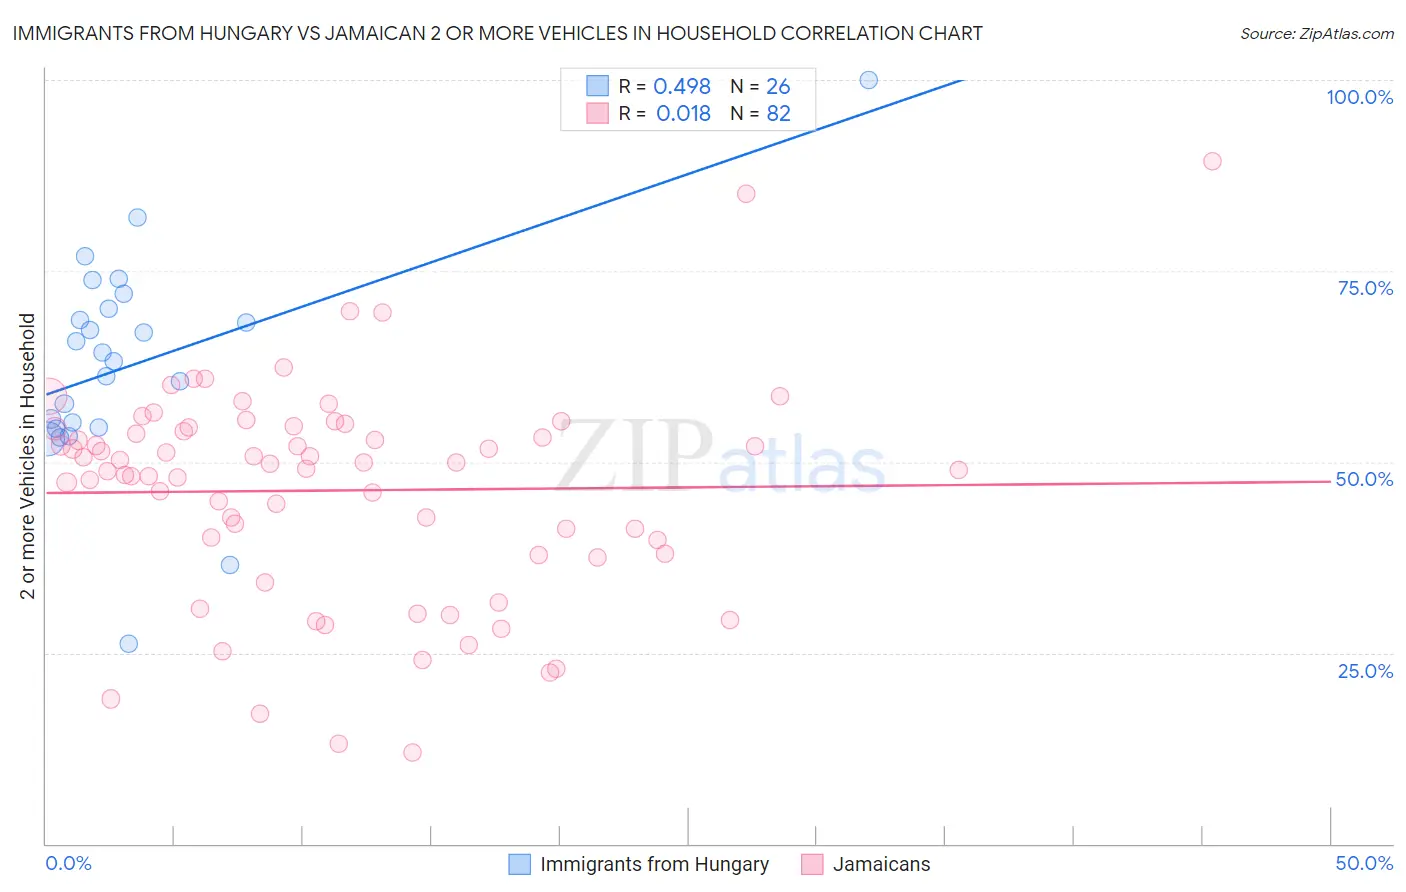
Immigrants from Hungary vs Jamaican 2 or more Vehicles in Household Correlation Chart
The statistical analysis conducted on geographies consisting of 195,676,046 people shows a moderate positive correlation between the proportion of Immigrants from Hungary and percentage of households with 2 or more vehicles available in the United States with a correlation coefficient (R) of 0.498 and weighted average of 54.2%. Similarly, the statistical analysis conducted on geographies consisting of 367,700,586 people shows no correlation between the proportion of Jamaicans and percentage of households with 2 or more vehicles available in the United States with a correlation coefficient (R) of 0.018 and weighted average of 45.8%, a difference of 18.4%.
2 or more Vehicles in Household Correlation Summary
| Measurement | Immigrants from Hungary | Jamaican |
| Minimum | 26.2% | 12.0% |
| Maximum | 100.0% | 89.3% |
| Range | 73.8% | 77.3% |
| Mean | 62.9% | 46.3% |
| Median | 63.8% | 49.4% |
| Interquartile 25% (IQ1) | 54.5% | 38.0% |
| Interquartile 75% (IQ3) | 70.1% | 54.3% |
| Interquartile Range (IQR) | 15.6% | 16.3% |
| Standard Deviation (Sample) | 14.2% | 14.2% |
| Standard Deviation (Population) | 13.9% | 14.1% |
Similar Demographics by 2 or more Vehicles in Household
Demographics Similar to Immigrants from Hungary by 2 or more Vehicles in Household
In terms of 2 or more vehicles in household, the demographic groups most similar to Immigrants from Hungary are Immigrants from Saudi Arabia (54.2%, a difference of 0.010%), Immigrants from Chile (54.2%, a difference of 0.020%), Egyptian (54.3%, a difference of 0.070%), Immigrants from Bulgaria (54.3%, a difference of 0.070%), and Turkish (54.3%, a difference of 0.16%).
| Demographics | Rating | Rank | 2 or more Vehicles in Household |
| Immigrants | Belgium | 13.7 /100 | #204 | Poor 54.3% |
| Cheyenne | 13.6 /100 | #205 | Poor 54.3% |
| Immigrants | Latin America | 13.1 /100 | #206 | Poor 54.3% |
| Turks | 13.0 /100 | #207 | Poor 54.3% |
| Egyptians | 12.0 /100 | #208 | Poor 54.3% |
| Immigrants | Bulgaria | 12.0 /100 | #209 | Poor 54.3% |
| Immigrants | Saudi Arabia | 11.3 /100 | #210 | Poor 54.2% |
| Immigrants | Hungary | 11.3 /100 | #211 | Poor 54.2% |
| Immigrants | Chile | 11.1 /100 | #212 | Poor 54.2% |
| Guatemalans | 9.6 /100 | #213 | Tragic 54.1% |
| Immigrants | Czechoslovakia | 9.4 /100 | #214 | Tragic 54.1% |
| Aleuts | 9.3 /100 | #215 | Tragic 54.1% |
| Immigrants | Western Asia | 9.3 /100 | #216 | Tragic 54.1% |
| Immigrants | Burma/Myanmar | 7.1 /100 | #217 | Tragic 53.9% |
| Immigrants | Argentina | 6.8 /100 | #218 | Tragic 53.9% |
Demographics Similar to Jamaicans by 2 or more Vehicles in Household
In terms of 2 or more vehicles in household, the demographic groups most similar to Jamaicans are Soviet Union (45.7%, a difference of 0.060%), Immigrants from Albania (46.0%, a difference of 0.52%), Immigrants from Haiti (46.5%, a difference of 1.7%), Cape Verdean (46.8%, a difference of 2.2%), and Puerto Rican (47.1%, a difference of 2.9%).
| Demographics | Rating | Rank | 2 or more Vehicles in Household |
| Haitians | 0.0 /100 | #312 | Tragic 47.6% |
| U.S. Virgin Islanders | 0.0 /100 | #313 | Tragic 47.5% |
| Immigrants | Ghana | 0.0 /100 | #314 | Tragic 47.4% |
| Puerto Ricans | 0.0 /100 | #315 | Tragic 47.1% |
| Cape Verdeans | 0.0 /100 | #316 | Tragic 46.8% |
| Immigrants | Haiti | 0.0 /100 | #317 | Tragic 46.5% |
| Immigrants | Albania | 0.0 /100 | #318 | Tragic 46.0% |
| Jamaicans | 0.0 /100 | #319 | Tragic 45.8% |
| Soviet Union | 0.0 /100 | #320 | Tragic 45.7% |
| Immigrants | Jamaica | 0.0 /100 | #321 | Tragic 44.5% |
| Senegalese | 0.0 /100 | #322 | Tragic 44.2% |
| Immigrants | Caribbean | 0.0 /100 | #323 | Tragic 44.2% |
| Immigrants | Cabo Verde | 0.0 /100 | #324 | Tragic 43.3% |
| Immigrants | West Indies | 0.0 /100 | #325 | Tragic 43.1% |
| Immigrants | Senegal | 0.0 /100 | #326 | Tragic 43.0% |