Native Hawaiian vs Immigrants from Nigeria 7th Grade
COMPARE
Native Hawaiian
Immigrants from Nigeria
7th Grade
7th Grade Comparison
Native Hawaiians
Immigrants from Nigeria
96.9%
7TH GRADE
99.7/ 100
METRIC RATING
67th/ 347
METRIC RANK
95.2%
7TH GRADE
0.4/ 100
METRIC RATING
264th/ 347
METRIC RANK
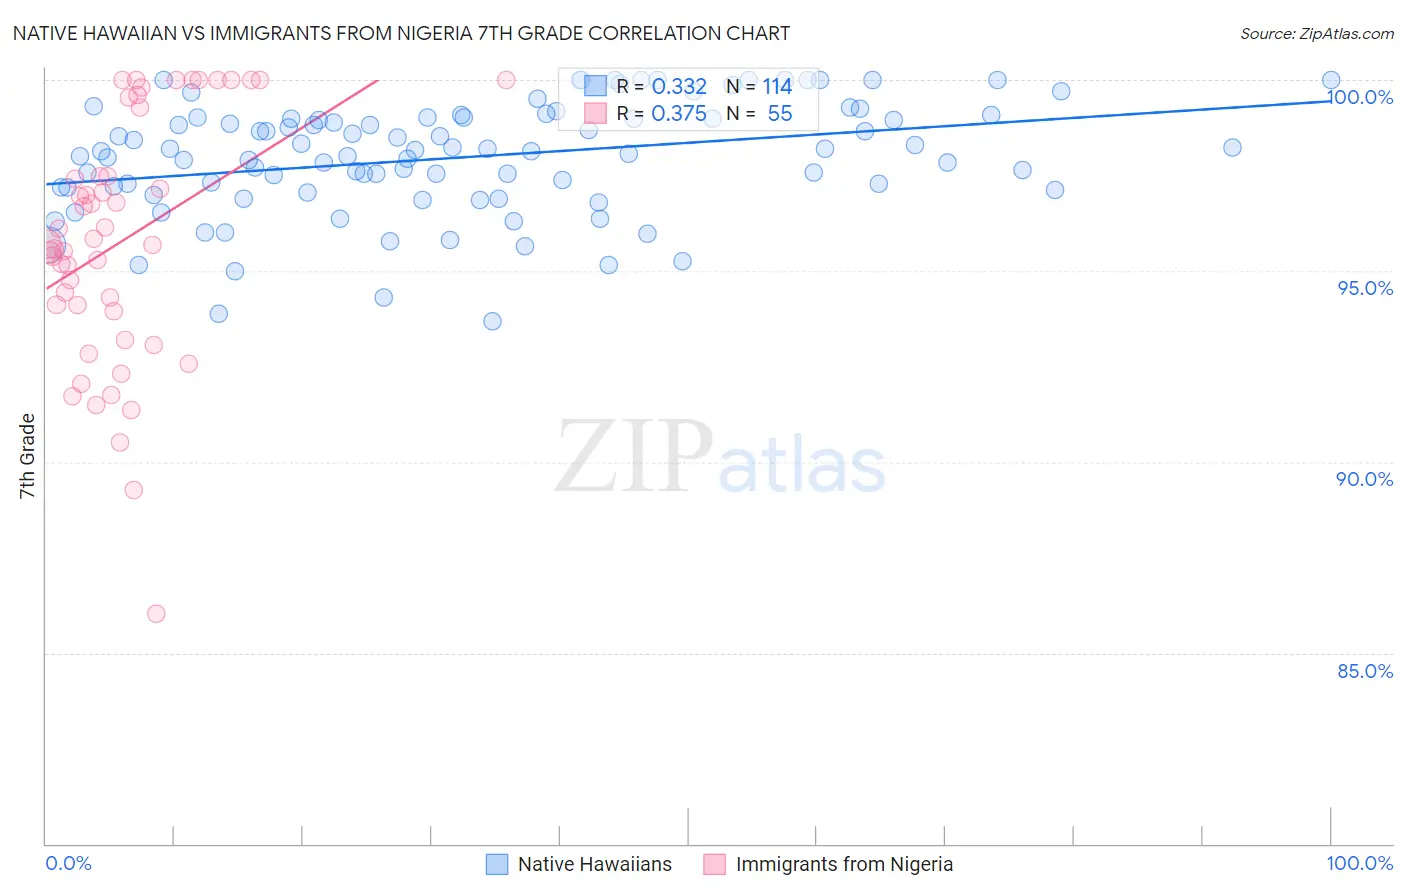
Native Hawaiian vs Immigrants from Nigeria 7th Grade Correlation Chart
The statistical analysis conducted on geographies consisting of 332,101,429 people shows a mild positive correlation between the proportion of Native Hawaiians and percentage of population with at least 7th grade education in the United States with a correlation coefficient (R) of 0.332 and weighted average of 96.9%. Similarly, the statistical analysis conducted on geographies consisting of 283,441,873 people shows a mild positive correlation between the proportion of Immigrants from Nigeria and percentage of population with at least 7th grade education in the United States with a correlation coefficient (R) of 0.375 and weighted average of 95.2%, a difference of 1.7%.
7th Grade Correlation Summary
| Measurement | Native Hawaiian | Immigrants from Nigeria |
| Minimum | 93.7% | 86.0% |
| Maximum | 100.0% | 100.0% |
| Range | 6.3% | 14.0% |
| Mean | 98.0% | 95.8% |
| Median | 98.2% | 95.7% |
| Interquartile 25% (IQ1) | 97.2% | 94.0% |
| Interquartile 75% (IQ3) | 99.0% | 99.3% |
| Interquartile Range (IQR) | 1.8% | 5.3% |
| Standard Deviation (Sample) | 1.5% | 3.2% |
| Standard Deviation (Population) | 1.5% | 3.2% |
Similar Demographics by 7th Grade
Demographics Similar to Native Hawaiians by 7th Grade
In terms of 7th grade, the demographic groups most similar to Native Hawaiians are Ukrainian (96.9%, a difference of 0.0%), Immigrants from Austria (96.9%, a difference of 0.020%), Canadian (96.9%, a difference of 0.020%), Immigrants from India (96.9%, a difference of 0.020%), and Immigrants from Northern Europe (96.9%, a difference of 0.030%).
| Demographics | Rating | Rank | 7th Grade |
| Immigrants | Canada | 99.8 /100 | #60 | Exceptional 96.9% |
| Creek | 99.8 /100 | #61 | Exceptional 96.9% |
| Immigrants | North America | 99.8 /100 | #62 | Exceptional 96.9% |
| Immigrants | Northern Europe | 99.7 /100 | #63 | Exceptional 96.9% |
| Immigrants | Austria | 99.7 /100 | #64 | Exceptional 96.9% |
| Canadians | 99.7 /100 | #65 | Exceptional 96.9% |
| Ukrainians | 99.7 /100 | #66 | Exceptional 96.9% |
| Native Hawaiians | 99.7 /100 | #67 | Exceptional 96.9% |
| Immigrants | India | 99.6 /100 | #68 | Exceptional 96.9% |
| Iranians | 99.6 /100 | #69 | Exceptional 96.8% |
| New Zealanders | 99.6 /100 | #70 | Exceptional 96.8% |
| Immigrants | Lithuania | 99.6 /100 | #71 | Exceptional 96.8% |
| Cajuns | 99.5 /100 | #72 | Exceptional 96.8% |
| Arapaho | 99.5 /100 | #73 | Exceptional 96.8% |
| Immigrants | England | 99.5 /100 | #74 | Exceptional 96.8% |
Demographics Similar to Immigrants from Nigeria by 7th Grade
In terms of 7th grade, the demographic groups most similar to Immigrants from Nigeria are South American (95.2%, a difference of 0.010%), Immigrants from Somalia (95.2%, a difference of 0.010%), West Indian (95.2%, a difference of 0.010%), Afghan (95.3%, a difference of 0.020%), and Immigrants from Uruguay (95.2%, a difference of 0.030%).
| Demographics | Rating | Rank | 7th Grade |
| Immigrants | Congo | 0.7 /100 | #257 | Tragic 95.3% |
| Ghanaians | 0.7 /100 | #258 | Tragic 95.3% |
| Immigrants | Costa Rica | 0.6 /100 | #259 | Tragic 95.3% |
| Afghans | 0.5 /100 | #260 | Tragic 95.3% |
| South Americans | 0.5 /100 | #261 | Tragic 95.2% |
| Immigrants | Somalia | 0.5 /100 | #262 | Tragic 95.2% |
| West Indians | 0.5 /100 | #263 | Tragic 95.2% |
| Immigrants | Nigeria | 0.4 /100 | #264 | Tragic 95.2% |
| Immigrants | Uruguay | 0.3 /100 | #265 | Tragic 95.2% |
| Immigrants | Ghana | 0.3 /100 | #266 | Tragic 95.2% |
| Yuman | 0.3 /100 | #267 | Tragic 95.2% |
| Immigrants | Hong Kong | 0.3 /100 | #268 | Tragic 95.2% |
| Trinidadians and Tobagonians | 0.3 /100 | #269 | Tragic 95.2% |
| Houma | 0.2 /100 | #270 | Tragic 95.1% |
| Immigrants | South America | 0.2 /100 | #271 | Tragic 95.1% |