Moroccan vs Yugoslavian Unemployment Among Ages 45 to 54 years
COMPARE
Moroccan
Yugoslavian
Unemployment Among Ages 45 to 54 years
Unemployment Among Ages 45 to 54 years Comparison
Moroccans
Yugoslavians
4.8%
UNEMPLOYMENT AMONG AGES 45 TO 54 YEARS
0.3/ 100
METRIC RATING
253rd/ 347
METRIC RANK
4.1%
UNEMPLOYMENT AMONG AGES 45 TO 54 YEARS
100.0/ 100
METRIC RATING
22nd/ 347
METRIC RANK
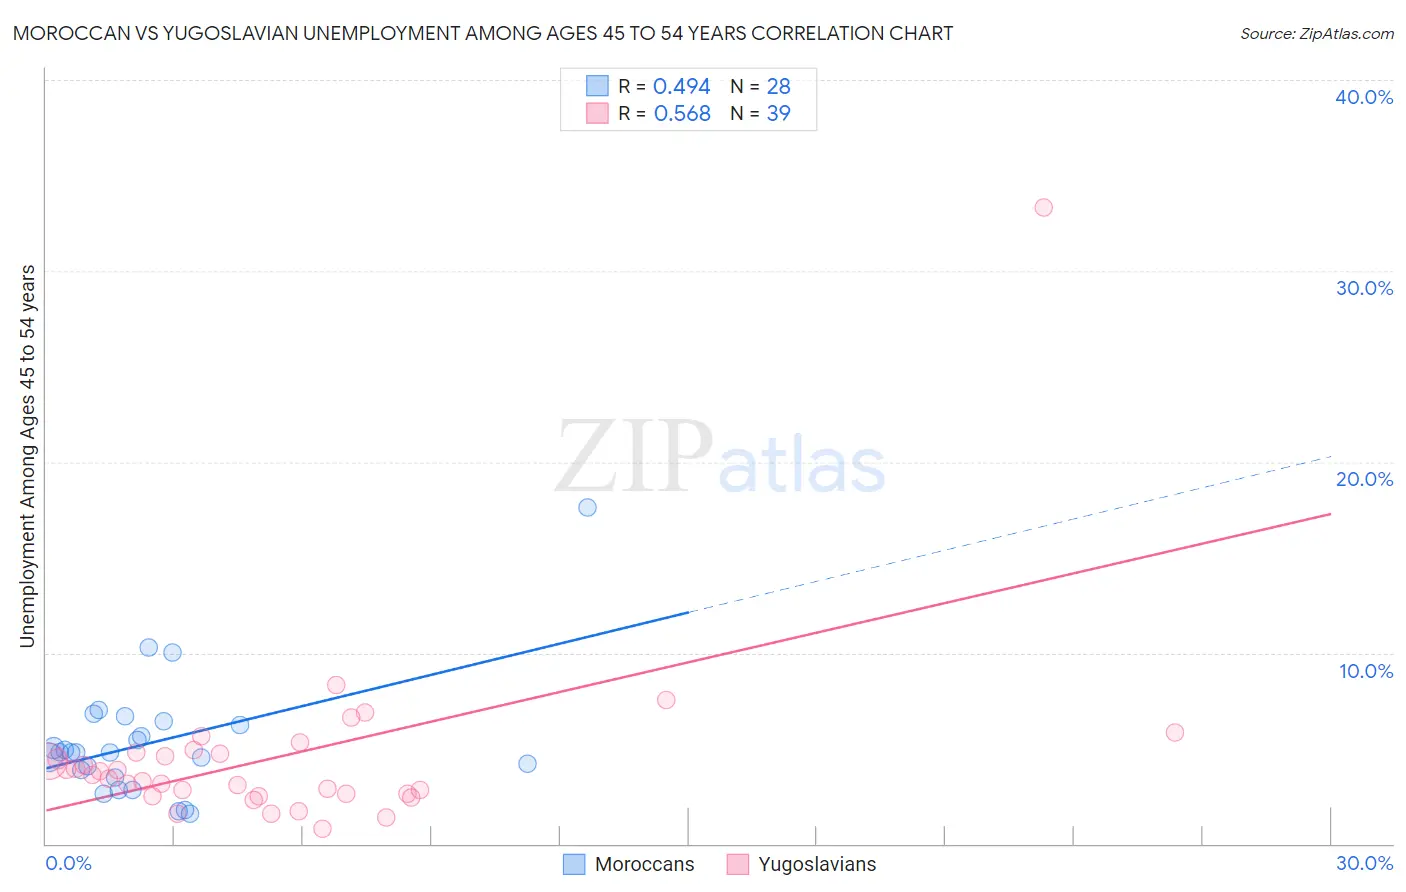
Moroccan vs Yugoslavian Unemployment Among Ages 45 to 54 years Correlation Chart
The statistical analysis conducted on geographies consisting of 199,854,001 people shows a moderate positive correlation between the proportion of Moroccans and unemployment rate among population between the ages 45 and 54 in the United States with a correlation coefficient (R) of 0.494 and weighted average of 4.8%. Similarly, the statistical analysis conducted on geographies consisting of 280,013,183 people shows a substantial positive correlation between the proportion of Yugoslavians and unemployment rate among population between the ages 45 and 54 in the United States with a correlation coefficient (R) of 0.568 and weighted average of 4.1%, a difference of 18.0%.
Unemployment Among Ages 45 to 54 years Correlation Summary
| Measurement | Moroccan | Yugoslavian |
| Minimum | 1.6% | 0.80% |
| Maximum | 17.6% | 33.3% |
| Range | 16.0% | 32.5% |
| Mean | 5.3% | 4.5% |
| Median | 4.8% | 3.6% |
| Interquartile 25% (IQ1) | 3.7% | 2.6% |
| Interquartile 75% (IQ3) | 6.3% | 4.8% |
| Interquartile Range (IQR) | 2.6% | 2.2% |
| Standard Deviation (Sample) | 3.2% | 5.0% |
| Standard Deviation (Population) | 3.1% | 5.0% |
Similar Demographics by Unemployment Among Ages 45 to 54 years
Demographics Similar to Moroccans by Unemployment Among Ages 45 to 54 years
In terms of unemployment among ages 45 to 54 years, the demographic groups most similar to Moroccans are Immigrants from Bahamas (4.8%, a difference of 0.17%), Immigrants from Lebanon (4.8%, a difference of 0.22%), Immigrants from El Salvador (4.8%, a difference of 0.35%), Honduran (4.8%, a difference of 0.41%), and Immigrants from Western Asia (4.8%, a difference of 0.43%).
| Demographics | Rating | Rank | Unemployment Among Ages 45 to 54 years |
| Immigrants | Syria | 0.9 /100 | #246 | Tragic 4.8% |
| Israelis | 0.9 /100 | #247 | Tragic 4.8% |
| Immigrants | Liberia | 0.8 /100 | #248 | Tragic 4.8% |
| Immigrants | Honduras | 0.7 /100 | #249 | Tragic 4.8% |
| Salvadorans | 0.7 /100 | #250 | Tragic 4.8% |
| Hondurans | 0.4 /100 | #251 | Tragic 4.8% |
| Immigrants | Bahamas | 0.3 /100 | #252 | Tragic 4.8% |
| Moroccans | 0.3 /100 | #253 | Tragic 4.8% |
| Immigrants | Lebanon | 0.2 /100 | #254 | Tragic 4.8% |
| Immigrants | El Salvador | 0.2 /100 | #255 | Tragic 4.8% |
| Immigrants | Western Asia | 0.2 /100 | #256 | Tragic 4.8% |
| Immigrants | Western Africa | 0.2 /100 | #257 | Tragic 4.9% |
| Sub-Saharan Africans | 0.2 /100 | #258 | Tragic 4.9% |
| Ugandans | 0.1 /100 | #259 | Tragic 4.9% |
| Mexican American Indians | 0.1 /100 | #260 | Tragic 4.9% |
Demographics Similar to Yugoslavians by Unemployment Among Ages 45 to 54 years
In terms of unemployment among ages 45 to 54 years, the demographic groups most similar to Yugoslavians are Bulgarian (4.1%, a difference of 0.010%), European (4.1%, a difference of 0.090%), English (4.1%, a difference of 0.42%), Swiss (4.1%, a difference of 0.58%), and Carpatho Rusyn (4.1%, a difference of 0.66%).
| Demographics | Rating | Rank | Unemployment Among Ages 45 to 54 years |
| Immigrants | Bolivia | 100.0 /100 | #15 | Exceptional 4.0% |
| Thais | 100.0 /100 | #16 | Exceptional 4.0% |
| Tongans | 100.0 /100 | #17 | Exceptional 4.1% |
| Germans | 100.0 /100 | #18 | Exceptional 4.1% |
| Swiss | 100.0 /100 | #19 | Exceptional 4.1% |
| English | 100.0 /100 | #20 | Exceptional 4.1% |
| Europeans | 100.0 /100 | #21 | Exceptional 4.1% |
| Yugoslavians | 100.0 /100 | #22 | Exceptional 4.1% |
| Bulgarians | 100.0 /100 | #23 | Exceptional 4.1% |
| Carpatho Rusyns | 100.0 /100 | #24 | Exceptional 4.1% |
| Bolivians | 99.9 /100 | #25 | Exceptional 4.1% |
| Scottish | 99.9 /100 | #26 | Exceptional 4.1% |
| Immigrants | Moldova | 99.9 /100 | #27 | Exceptional 4.1% |
| Welsh | 99.9 /100 | #28 | Exceptional 4.1% |
| Belgians | 99.9 /100 | #29 | Exceptional 4.1% |