Basque vs Pueblo 2 or more Vehicles in Household
COMPARE
Basque
Pueblo
2 or more Vehicles in Household
2 or more Vehicles in Household Comparison
Basques
Pueblo
61.4%
2 OR MORE VEHICLES IN HOUSEHOLD
100.0/ 100
METRIC RATING
17th/ 347
METRIC RANK
57.5%
2 OR MORE VEHICLES IN HOUSEHOLD
98.0/ 100
METRIC RATING
112th/ 347
METRIC RANK
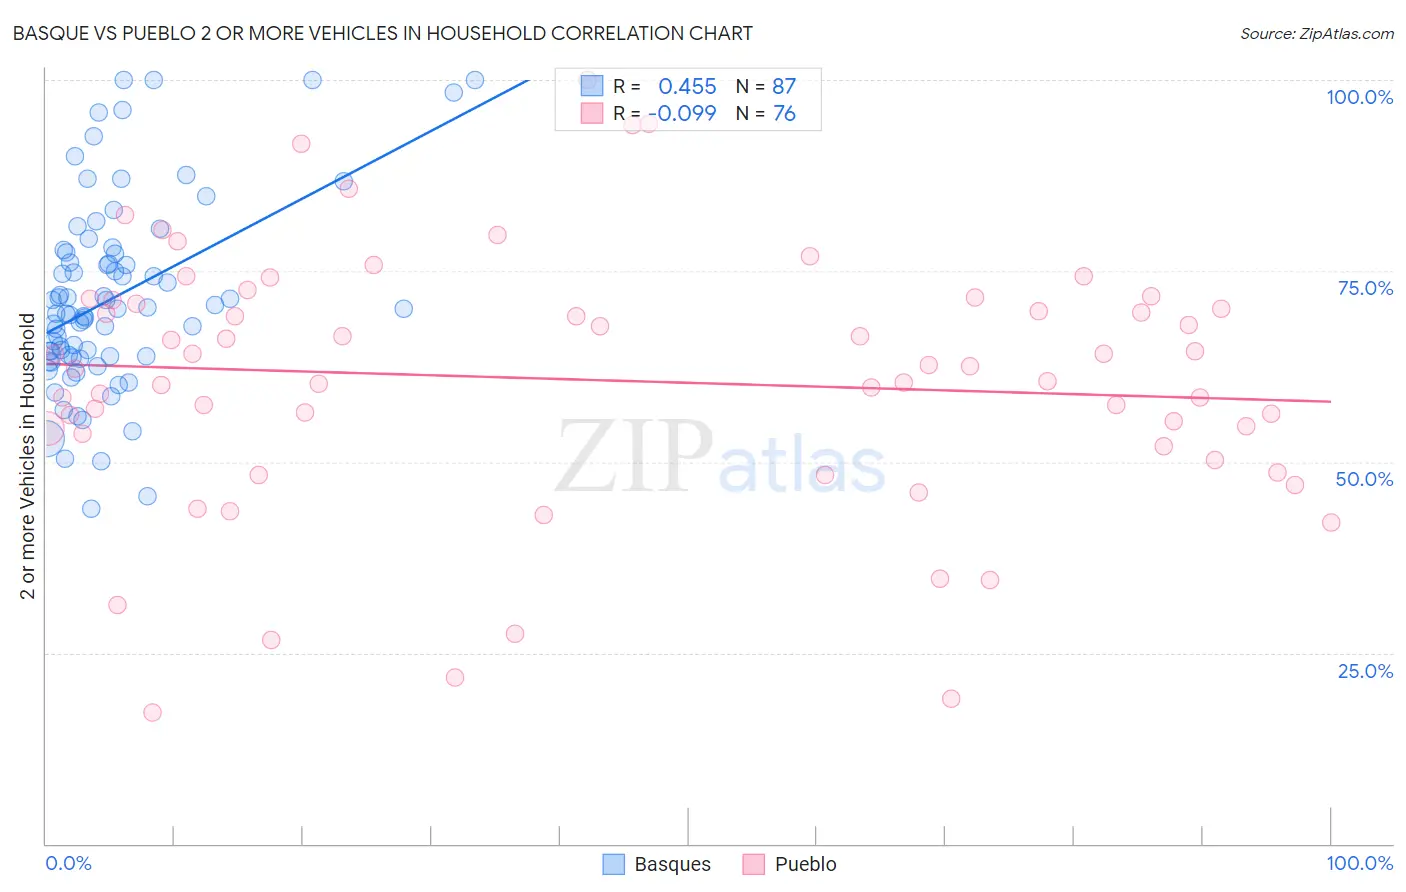
Basque vs Pueblo 2 or more Vehicles in Household Correlation Chart
The statistical analysis conducted on geographies consisting of 165,752,763 people shows a moderate positive correlation between the proportion of Basques and percentage of households with 2 or more vehicles available in the United States with a correlation coefficient (R) of 0.455 and weighted average of 61.4%. Similarly, the statistical analysis conducted on geographies consisting of 120,072,908 people shows a slight negative correlation between the proportion of Pueblo and percentage of households with 2 or more vehicles available in the United States with a correlation coefficient (R) of -0.099 and weighted average of 57.5%, a difference of 6.8%.
2 or more Vehicles in Household Correlation Summary
| Measurement | Basque | Pueblo |
| Minimum | 43.9% | 17.1% |
| Maximum | 100.0% | 100.0% |
| Range | 56.1% | 82.9% |
| Mean | 71.5% | 60.7% |
| Median | 70.0% | 62.3% |
| Interquartile 25% (IQ1) | 63.8% | 52.9% |
| Interquartile 75% (IQ3) | 77.4% | 70.9% |
| Interquartile Range (IQR) | 13.6% | 18.0% |
| Standard Deviation (Sample) | 12.5% | 17.0% |
| Standard Deviation (Population) | 12.4% | 16.9% |
Similar Demographics by 2 or more Vehicles in Household
Demographics Similar to Basques by 2 or more Vehicles in Household
In terms of 2 or more vehicles in household, the demographic groups most similar to Basques are European (61.4%, a difference of 0.020%), Native Hawaiian (61.4%, a difference of 0.070%), Nepalese (61.4%, a difference of 0.090%), Czech (61.5%, a difference of 0.18%), and Samoan (61.5%, a difference of 0.22%).
| Demographics | Rating | Rank | 2 or more Vehicles in Household |
| Mexicans | 100.0 /100 | #10 | Exceptional 61.7% |
| Dutch | 100.0 /100 | #11 | Exceptional 61.6% |
| Germans | 100.0 /100 | #12 | Exceptional 61.6% |
| Samoans | 100.0 /100 | #13 | Exceptional 61.5% |
| Czechs | 100.0 /100 | #14 | Exceptional 61.5% |
| Nepalese | 100.0 /100 | #15 | Exceptional 61.4% |
| Native Hawaiians | 100.0 /100 | #16 | Exceptional 61.4% |
| Basques | 100.0 /100 | #17 | Exceptional 61.4% |
| Europeans | 100.0 /100 | #18 | Exceptional 61.4% |
| Scottish | 100.0 /100 | #19 | Exceptional 61.2% |
| Sri Lankans | 100.0 /100 | #20 | Exceptional 61.0% |
| Koreans | 100.0 /100 | #21 | Exceptional 61.0% |
| Swiss | 100.0 /100 | #22 | Exceptional 61.0% |
| Scotch-Irish | 100.0 /100 | #23 | Exceptional 60.9% |
| Immigrants | Vietnam | 100.0 /100 | #24 | Exceptional 60.9% |
Demographics Similar to Pueblo by 2 or more Vehicles in Household
In terms of 2 or more vehicles in household, the demographic groups most similar to Pueblo are Greek (57.5%, a difference of 0.0%), Japanese (57.5%, a difference of 0.040%), Immigrants from North America (57.5%, a difference of 0.050%), Immigrants from Canada (57.5%, a difference of 0.090%), and Immigrants from Netherlands (57.5%, a difference of 0.10%).
| Demographics | Rating | Rank | 2 or more Vehicles in Household |
| Immigrants | Korea | 98.2 /100 | #105 | Exceptional 57.6% |
| Immigrants | Oceania | 98.2 /100 | #106 | Exceptional 57.5% |
| Immigrants | Netherlands | 98.2 /100 | #107 | Exceptional 57.5% |
| Immigrants | Canada | 98.1 /100 | #108 | Exceptional 57.5% |
| Immigrants | North America | 98.1 /100 | #109 | Exceptional 57.5% |
| Japanese | 98.0 /100 | #110 | Exceptional 57.5% |
| Greeks | 98.0 /100 | #111 | Exceptional 57.5% |
| Pueblo | 98.0 /100 | #112 | Exceptional 57.5% |
| Zimbabweans | 96.9 /100 | #113 | Exceptional 57.2% |
| Immigrants | Lebanon | 96.8 /100 | #114 | Exceptional 57.2% |
| Chippewa | 96.6 /100 | #115 | Exceptional 57.2% |
| Immigrants | Jordan | 96.6 /100 | #116 | Exceptional 57.2% |
| Iraqis | 95.8 /100 | #117 | Exceptional 57.1% |
| Asians | 95.1 /100 | #118 | Exceptional 57.0% |
| Natives/Alaskans | 95.0 /100 | #119 | Exceptional 57.0% |