Marshallese vs Carpatho Rusyn 1 or more Vehicles in Household
COMPARE
Marshallese
Carpatho Rusyn
1 or more Vehicles in Household
1 or more Vehicles in Household Comparison
Marshallese
Carpatho Rusyns
90.4%
1 OR MORE VEHICLES IN HOUSEHOLD
88.9/ 100
METRIC RATING
129th/ 347
METRIC RANK
89.5%
1 OR MORE VEHICLES IN HOUSEHOLD
37.8/ 100
METRIC RATING
189th/ 347
METRIC RANK
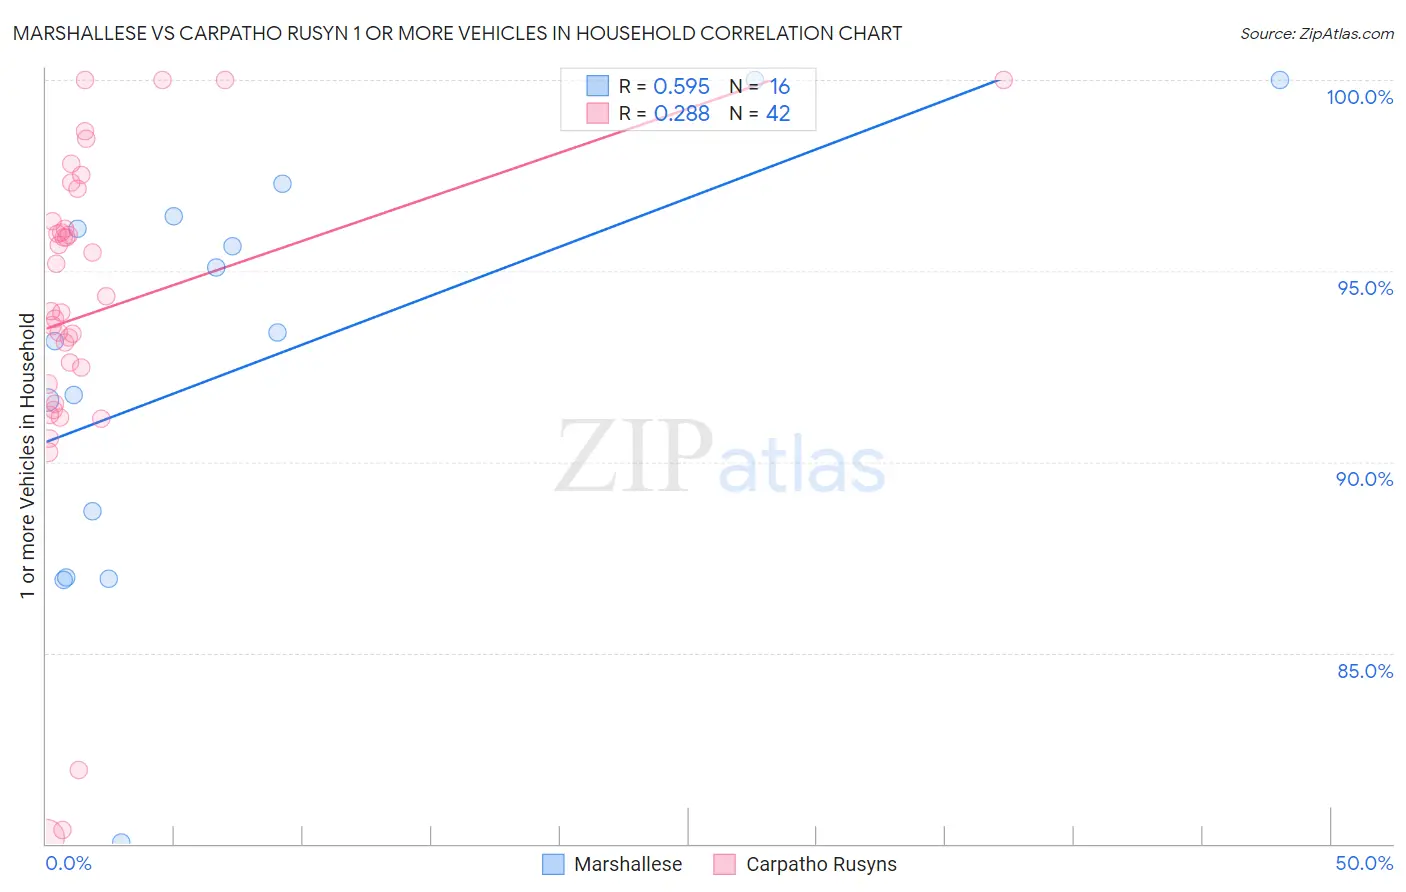
Marshallese vs Carpatho Rusyn 1 or more Vehicles in Household Correlation Chart
The statistical analysis conducted on geographies consisting of 14,761,315 people shows a substantial positive correlation between the proportion of Marshallese and percentage of households with 1 or more vehicles available in the United States with a correlation coefficient (R) of 0.595 and weighted average of 90.4%. Similarly, the statistical analysis conducted on geographies consisting of 58,871,690 people shows a weak positive correlation between the proportion of Carpatho Rusyns and percentage of households with 1 or more vehicles available in the United States with a correlation coefficient (R) of 0.288 and weighted average of 89.5%, a difference of 1.0%.
1 or more Vehicles in Household Correlation Summary
| Measurement | Marshallese | Carpatho Rusyn |
| Minimum | 80.0% | 80.2% |
| Maximum | 100.0% | 100.0% |
| Range | 20.0% | 19.8% |
| Mean | 92.5% | 93.9% |
| Median | 93.3% | 94.1% |
| Interquartile 25% (IQ1) | 87.8% | 92.0% |
| Interquartile 75% (IQ3) | 96.3% | 96.3% |
| Interquartile Range (IQR) | 8.4% | 4.3% |
| Standard Deviation (Sample) | 5.5% | 4.6% |
| Standard Deviation (Population) | 5.3% | 4.5% |
Similar Demographics by 1 or more Vehicles in Household
Demographics Similar to Marshallese by 1 or more Vehicles in Household
In terms of 1 or more vehicles in household, the demographic groups most similar to Marshallese are Nicaraguan (90.4%, a difference of 0.0%), Immigrants from the Azores (90.4%, a difference of 0.010%), Burmese (90.4%, a difference of 0.010%), Immigrants from Cameroon (90.4%, a difference of 0.020%), and Immigrants from Kenya (90.4%, a difference of 0.020%).
| Demographics | Rating | Rank | 1 or more Vehicles in Household |
| Costa Ricans | 92.0 /100 | #122 | Exceptional 90.5% |
| Fijians | 91.8 /100 | #123 | Exceptional 90.5% |
| Puget Sound Salish | 91.5 /100 | #124 | Exceptional 90.5% |
| Immigrants | Korea | 90.5 /100 | #125 | Exceptional 90.5% |
| Immigrants | Cameroon | 89.4 /100 | #126 | Excellent 90.4% |
| Immigrants | Azores | 89.1 /100 | #127 | Excellent 90.4% |
| Burmese | 89.0 /100 | #128 | Excellent 90.4% |
| Marshallese | 88.9 /100 | #129 | Excellent 90.4% |
| Nicaraguans | 88.8 /100 | #130 | Excellent 90.4% |
| Immigrants | Kenya | 88.5 /100 | #131 | Excellent 90.4% |
| Immigrants | South Africa | 88.1 /100 | #132 | Excellent 90.4% |
| Immigrants | Syria | 87.5 /100 | #133 | Excellent 90.4% |
| Kenyans | 87.0 /100 | #134 | Excellent 90.4% |
| Immigrants | Oceania | 86.9 /100 | #135 | Excellent 90.4% |
| Hungarians | 86.5 /100 | #136 | Excellent 90.3% |
Demographics Similar to Carpatho Rusyns by 1 or more Vehicles in Household
In terms of 1 or more vehicles in household, the demographic groups most similar to Carpatho Rusyns are Shoshone (89.5%, a difference of 0.0%), Immigrants from Poland (89.5%, a difference of 0.010%), Immigrants from Nepal (89.5%, a difference of 0.020%), Immigrants from North Macedonia (89.5%, a difference of 0.020%), and South American (89.5%, a difference of 0.030%).
| Demographics | Rating | Rank | 1 or more Vehicles in Household |
| Ukrainians | 42.4 /100 | #182 | Average 89.6% |
| Ethiopians | 41.2 /100 | #183 | Average 89.6% |
| Immigrants | Bulgaria | 40.7 /100 | #184 | Average 89.6% |
| Immigrants | Brazil | 40.1 /100 | #185 | Average 89.6% |
| Pueblo | 39.9 /100 | #186 | Fair 89.6% |
| South Americans | 39.6 /100 | #187 | Fair 89.5% |
| Immigrants | Nepal | 38.9 /100 | #188 | Fair 89.5% |
| Carpatho Rusyns | 37.8 /100 | #189 | Fair 89.5% |
| Shoshone | 37.5 /100 | #190 | Fair 89.5% |
| Immigrants | Poland | 37.1 /100 | #191 | Fair 89.5% |
| Immigrants | North Macedonia | 36.5 /100 | #192 | Fair 89.5% |
| Immigrants | Northern Europe | 35.5 /100 | #193 | Fair 89.5% |
| Immigrants | Eritrea | 33.2 /100 | #194 | Fair 89.4% |
| Immigrants | Armenia | 31.8 /100 | #195 | Fair 89.4% |
| Crow | 24.3 /100 | #196 | Fair 89.3% |