Immigrants from Czechoslovakia vs Carpatho Rusyn 1 or more Vehicles in Household
COMPARE
Immigrants from Czechoslovakia
Carpatho Rusyn
1 or more Vehicles in Household
1 or more Vehicles in Household Comparison
Immigrants from Czechoslovakia
Carpatho Rusyns
88.3%
1 OR MORE VEHICLES IN HOUSEHOLD
1.9/ 100
METRIC RATING
245th/ 347
METRIC RANK
89.5%
1 OR MORE VEHICLES IN HOUSEHOLD
37.8/ 100
METRIC RATING
189th/ 347
METRIC RANK
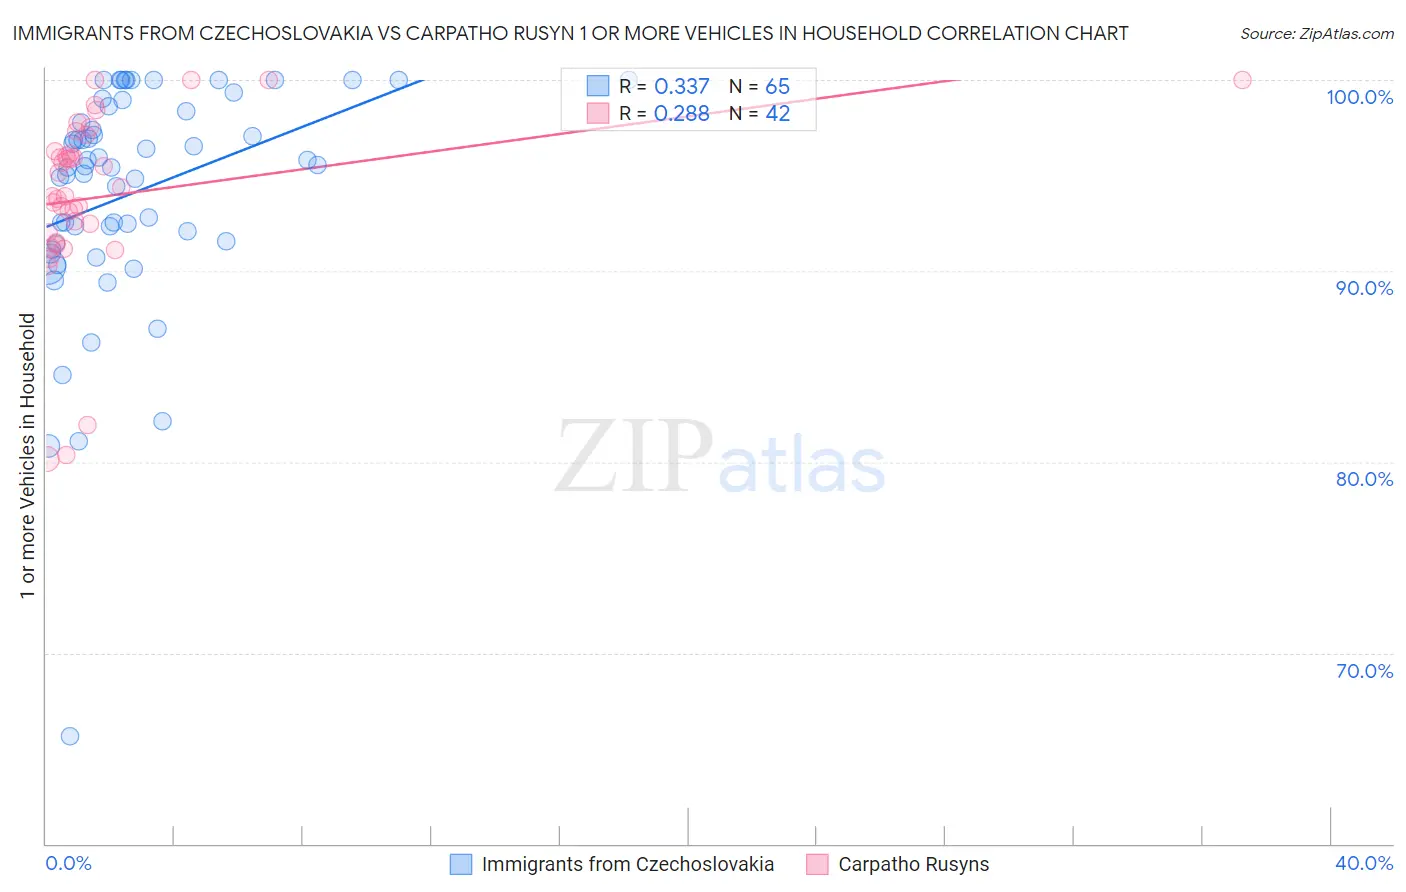
Immigrants from Czechoslovakia vs Carpatho Rusyn 1 or more Vehicles in Household Correlation Chart
The statistical analysis conducted on geographies consisting of 195,451,369 people shows a mild positive correlation between the proportion of Immigrants from Czechoslovakia and percentage of households with 1 or more vehicles available in the United States with a correlation coefficient (R) of 0.337 and weighted average of 88.3%. Similarly, the statistical analysis conducted on geographies consisting of 58,871,690 people shows a weak positive correlation between the proportion of Carpatho Rusyns and percentage of households with 1 or more vehicles available in the United States with a correlation coefficient (R) of 0.288 and weighted average of 89.5%, a difference of 1.3%.
1 or more Vehicles in Household Correlation Summary
| Measurement | Immigrants from Czechoslovakia | Carpatho Rusyn |
| Minimum | 65.6% | 80.2% |
| Maximum | 100.0% | 100.0% |
| Range | 34.4% | 19.8% |
| Mean | 94.1% | 93.9% |
| Median | 95.5% | 94.1% |
| Interquartile 25% (IQ1) | 91.5% | 92.0% |
| Interquartile 75% (IQ3) | 98.5% | 96.3% |
| Interquartile Range (IQR) | 7.0% | 4.3% |
| Standard Deviation (Sample) | 6.0% | 4.6% |
| Standard Deviation (Population) | 5.9% | 4.5% |
Similar Demographics by 1 or more Vehicles in Household
Demographics Similar to Immigrants from Czechoslovakia by 1 or more Vehicles in Household
In terms of 1 or more vehicles in household, the demographic groups most similar to Immigrants from Czechoslovakia are Immigrants from Portugal (88.3%, a difference of 0.010%), Menominee (88.3%, a difference of 0.010%), Immigrants from Belgium (88.4%, a difference of 0.040%), Immigrants from Honduras (88.3%, a difference of 0.050%), and Immigrants from Nigeria (88.2%, a difference of 0.090%).
| Demographics | Rating | Rank | 1 or more Vehicles in Household |
| Immigrants | Somalia | 4.2 /100 | #238 | Tragic 88.6% |
| Kiowa | 3.8 /100 | #239 | Tragic 88.6% |
| Eastern Europeans | 3.0 /100 | #240 | Tragic 88.5% |
| Taiwanese | 2.6 /100 | #241 | Tragic 88.4% |
| Turks | 2.5 /100 | #242 | Tragic 88.4% |
| Immigrants | Belgium | 2.1 /100 | #243 | Tragic 88.4% |
| Immigrants | Portugal | 2.0 /100 | #244 | Tragic 88.3% |
| Immigrants | Czechoslovakia | 1.9 /100 | #245 | Tragic 88.3% |
| Menominee | 1.9 /100 | #246 | Tragic 88.3% |
| Immigrants | Honduras | 1.7 /100 | #247 | Tragic 88.3% |
| Immigrants | Nigeria | 1.5 /100 | #248 | Tragic 88.2% |
| Blacks/African Americans | 1.4 /100 | #249 | Tragic 88.2% |
| Egyptians | 1.2 /100 | #250 | Tragic 88.2% |
| Immigrants | Serbia | 1.2 /100 | #251 | Tragic 88.2% |
| Immigrants | Uruguay | 1.1 /100 | #252 | Tragic 88.1% |
Demographics Similar to Carpatho Rusyns by 1 or more Vehicles in Household
In terms of 1 or more vehicles in household, the demographic groups most similar to Carpatho Rusyns are Shoshone (89.5%, a difference of 0.0%), Immigrants from Poland (89.5%, a difference of 0.010%), Immigrants from Nepal (89.5%, a difference of 0.020%), Immigrants from North Macedonia (89.5%, a difference of 0.020%), and South American (89.5%, a difference of 0.030%).
| Demographics | Rating | Rank | 1 or more Vehicles in Household |
| Ukrainians | 42.4 /100 | #182 | Average 89.6% |
| Ethiopians | 41.2 /100 | #183 | Average 89.6% |
| Immigrants | Bulgaria | 40.7 /100 | #184 | Average 89.6% |
| Immigrants | Brazil | 40.1 /100 | #185 | Average 89.6% |
| Pueblo | 39.9 /100 | #186 | Fair 89.6% |
| South Americans | 39.6 /100 | #187 | Fair 89.5% |
| Immigrants | Nepal | 38.9 /100 | #188 | Fair 89.5% |
| Carpatho Rusyns | 37.8 /100 | #189 | Fair 89.5% |
| Shoshone | 37.5 /100 | #190 | Fair 89.5% |
| Immigrants | Poland | 37.1 /100 | #191 | Fair 89.5% |
| Immigrants | North Macedonia | 36.5 /100 | #192 | Fair 89.5% |
| Immigrants | Northern Europe | 35.5 /100 | #193 | Fair 89.5% |
| Immigrants | Eritrea | 33.2 /100 | #194 | Fair 89.4% |
| Immigrants | Armenia | 31.8 /100 | #195 | Fair 89.4% |
| Crow | 24.3 /100 | #196 | Fair 89.3% |