Malaysian vs Basque In Labor Force | Age 20-24
COMPARE
Malaysian
Basque
In Labor Force | Age 20-24
In Labor Force | Age 20-24 Comparison
Malaysians
Basques
77.2%
IN LABOR FORCE | AGE 20-24
100.0/ 100
METRIC RATING
50th/ 347
METRIC RANK
76.5%
IN LABOR FORCE | AGE 20-24
99.5/ 100
METRIC RATING
81st/ 347
METRIC RANK
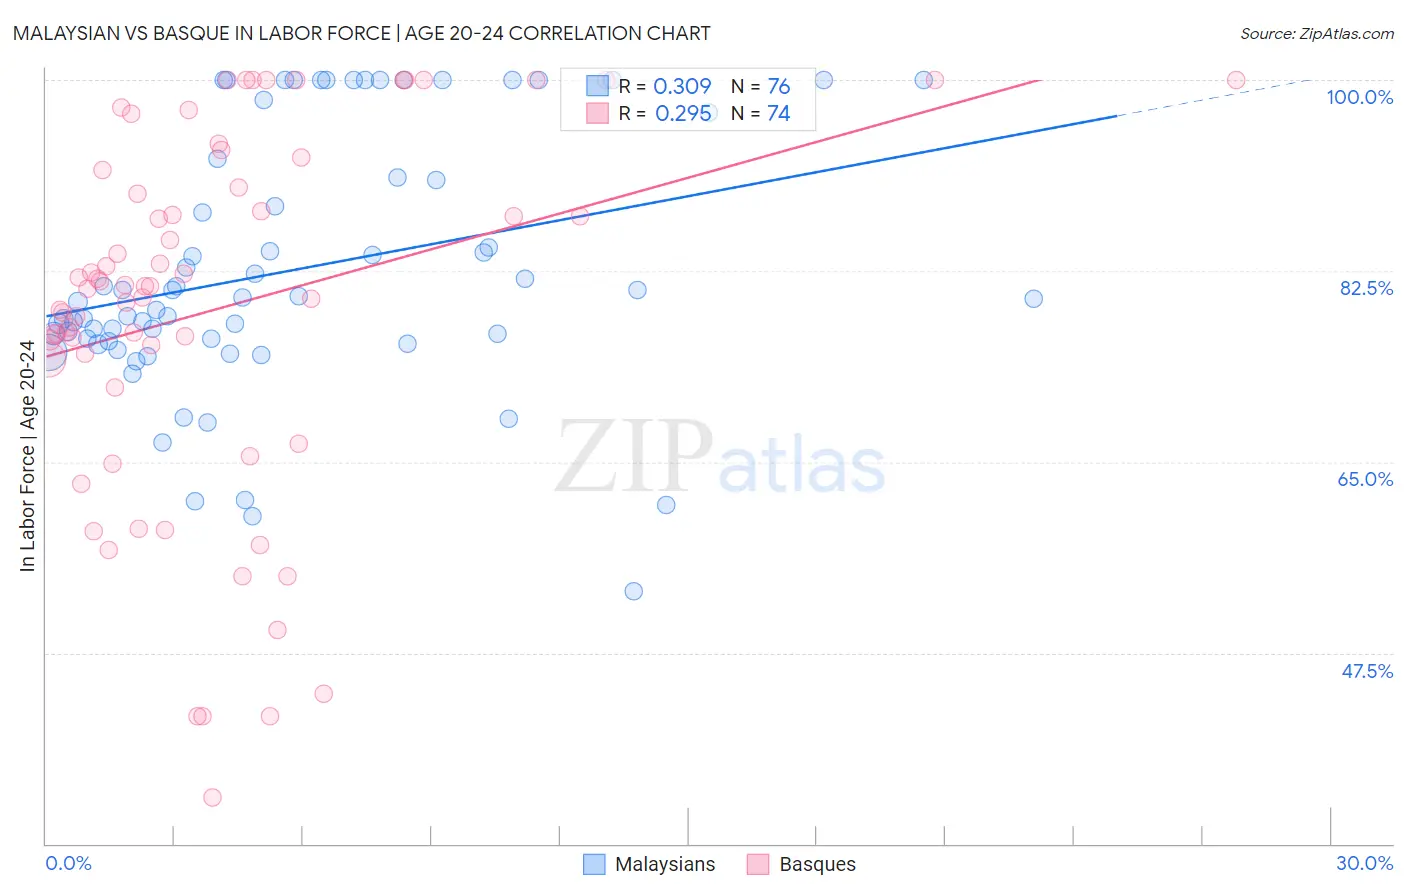
Malaysian vs Basque In Labor Force | Age 20-24 Correlation Chart
The statistical analysis conducted on geographies consisting of 226,070,224 people shows a mild positive correlation between the proportion of Malaysians and labor force participation rate among population between the ages 20 and 24 in the United States with a correlation coefficient (R) of 0.309 and weighted average of 77.2%. Similarly, the statistical analysis conducted on geographies consisting of 165,718,076 people shows a weak positive correlation between the proportion of Basques and labor force participation rate among population between the ages 20 and 24 in the United States with a correlation coefficient (R) of 0.295 and weighted average of 76.5%, a difference of 0.91%.
In Labor Force | Age 20-24 Correlation Summary
| Measurement | Malaysian | Basque |
| Minimum | 53.1% | 34.2% |
| Maximum | 100.0% | 100.0% |
| Range | 46.9% | 65.8% |
| Mean | 82.6% | 79.0% |
| Median | 80.0% | 81.1% |
| Interquartile 25% (IQ1) | 76.2% | 74.4% |
| Interquartile 75% (IQ3) | 92.0% | 91.7% |
| Interquartile Range (IQR) | 15.8% | 17.3% |
| Standard Deviation (Sample) | 11.7% | 16.7% |
| Standard Deviation (Population) | 11.6% | 16.6% |
Similar Demographics by In Labor Force | Age 20-24
Demographics Similar to Malaysians by In Labor Force | Age 20-24
In terms of in labor force | age 20-24, the demographic groups most similar to Malaysians are Croatian (77.2%, a difference of 0.010%), Indonesian (77.2%, a difference of 0.020%), Immigrants from the Azores (77.2%, a difference of 0.030%), Chinese (77.3%, a difference of 0.040%), and Serbian (77.3%, a difference of 0.050%).
| Demographics | Rating | Rank | In Labor Force | Age 20-24 |
| Immigrants | Laos | 100.0 /100 | #43 | Exceptional 77.4% |
| Fijians | 100.0 /100 | #44 | Exceptional 77.4% |
| Native Hawaiians | 100.0 /100 | #45 | Exceptional 77.4% |
| Samoans | 100.0 /100 | #46 | Exceptional 77.4% |
| Ethiopians | 100.0 /100 | #47 | Exceptional 77.3% |
| Serbians | 100.0 /100 | #48 | Exceptional 77.3% |
| Chinese | 100.0 /100 | #49 | Exceptional 77.3% |
| Malaysians | 100.0 /100 | #50 | Exceptional 77.2% |
| Croatians | 100.0 /100 | #51 | Exceptional 77.2% |
| Indonesians | 100.0 /100 | #52 | Exceptional 77.2% |
| Immigrants | Azores | 100.0 /100 | #53 | Exceptional 77.2% |
| Celtics | 99.9 /100 | #54 | Exceptional 77.1% |
| Immigrants | Liberia | 99.9 /100 | #55 | Exceptional 77.1% |
| Europeans | 99.9 /100 | #56 | Exceptional 77.1% |
| Chippewa | 99.9 /100 | #57 | Exceptional 77.1% |
Demographics Similar to Basques by In Labor Force | Age 20-24
In terms of in labor force | age 20-24, the demographic groups most similar to Basques are Hmong (76.5%, a difference of 0.0%), Italian (76.5%, a difference of 0.020%), Immigrants from Zaire (76.6%, a difference of 0.040%), Canadian (76.6%, a difference of 0.060%), and Immigrants from Cameroon (76.6%, a difference of 0.070%).
| Demographics | Rating | Rank | In Labor Force | Age 20-24 |
| Cree | 99.7 /100 | #74 | Exceptional 76.6% |
| Immigrants | Middle Africa | 99.7 /100 | #75 | Exceptional 76.6% |
| Immigrants | Moldova | 99.6 /100 | #76 | Exceptional 76.6% |
| Immigrants | Cameroon | 99.6 /100 | #77 | Exceptional 76.6% |
| Canadians | 99.6 /100 | #78 | Exceptional 76.6% |
| Immigrants | Zaire | 99.6 /100 | #79 | Exceptional 76.6% |
| Italians | 99.6 /100 | #80 | Exceptional 76.5% |
| Basques | 99.5 /100 | #81 | Exceptional 76.5% |
| Hmong | 99.5 /100 | #82 | Exceptional 76.5% |
| Carpatho Rusyns | 99.4 /100 | #83 | Exceptional 76.5% |
| Austrians | 99.4 /100 | #84 | Exceptional 76.5% |
| Portuguese | 99.3 /100 | #85 | Exceptional 76.4% |
| Immigrants | Iraq | 99.3 /100 | #86 | Exceptional 76.4% |
| Immigrants | Thailand | 99.3 /100 | #87 | Exceptional 76.4% |
| Spanish | 99.2 /100 | #88 | Exceptional 76.4% |