Malaysian vs Aleut No Vehicles in Household
COMPARE
Malaysian
Aleut
No Vehicles in Household
No Vehicles in Household Comparison
Malaysians
Aleuts
7.7%
NO VEHICLES IN HOUSEHOLD
100.0/ 100
METRIC RATING
32nd/ 347
METRIC RANK
13.0%
NO VEHICLES IN HOUSEHOLD
0.1/ 100
METRIC RATING
277th/ 347
METRIC RANK
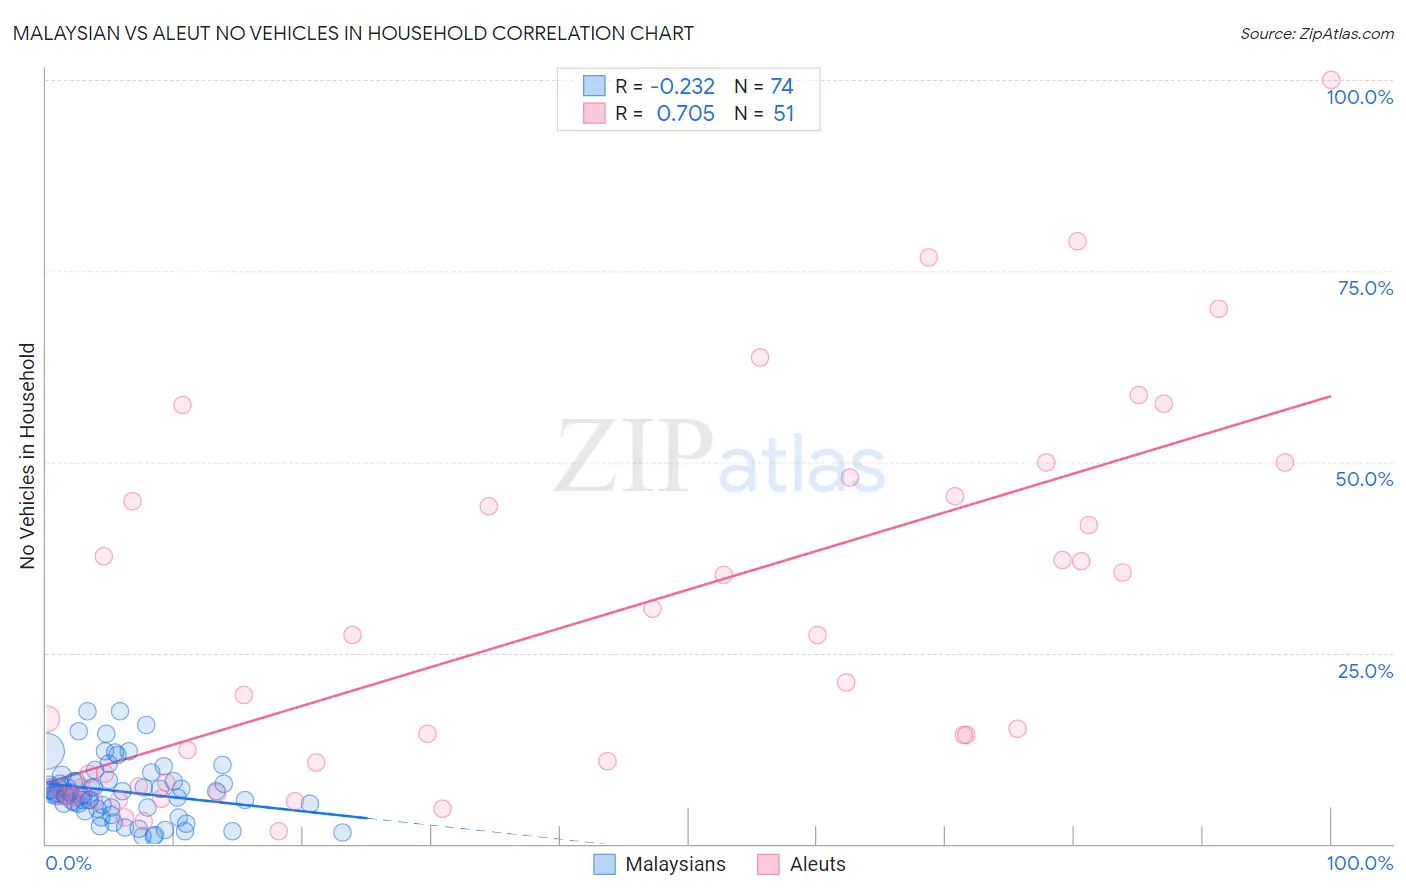
Malaysian vs Aleut No Vehicles in Household Correlation Chart
The statistical analysis conducted on geographies consisting of 225,868,450 people shows a weak negative correlation between the proportion of Malaysians and percentage of households with no vehicle available in the United States with a correlation coefficient (R) of -0.232 and weighted average of 7.7%. Similarly, the statistical analysis conducted on geographies consisting of 61,729,503 people shows a strong positive correlation between the proportion of Aleuts and percentage of households with no vehicle available in the United States with a correlation coefficient (R) of 0.705 and weighted average of 13.0%, a difference of 69.0%.
No Vehicles in Household Correlation Summary
| Measurement | Malaysian | Aleut |
| Minimum | 0.99% | 1.7% |
| Maximum | 17.4% | 100.0% |
| Range | 16.4% | 98.3% |
| Mean | 6.9% | 27.7% |
| Median | 6.6% | 16.4% |
| Interquartile 25% (IQ1) | 4.8% | 7.3% |
| Interquartile 75% (IQ3) | 8.2% | 44.8% |
| Interquartile Range (IQR) | 3.4% | 37.5% |
| Standard Deviation (Sample) | 3.7% | 24.2% |
| Standard Deviation (Population) | 3.7% | 23.9% |
Similar Demographics by No Vehicles in Household
Demographics Similar to Malaysians by No Vehicles in Household
In terms of no vehicles in household, the demographic groups most similar to Malaysians are Immigrants from Taiwan (7.7%, a difference of 0.11%), Immigrants from Vietnam (7.7%, a difference of 0.24%), Native Hawaiian (7.7%, a difference of 0.25%), Cherokee (7.7%, a difference of 0.38%), and Finnish (7.7%, a difference of 0.40%).
| Demographics | Rating | Rank | No Vehicles in Household |
| Yaqui | 100.0 /100 | #25 | Exceptional 7.5% |
| Sri Lankans | 100.0 /100 | #26 | Exceptional 7.6% |
| British | 100.0 /100 | #27 | Exceptional 7.6% |
| Samoans | 100.0 /100 | #28 | Exceptional 7.6% |
| Americans | 100.0 /100 | #29 | Exceptional 7.7% |
| Finns | 100.0 /100 | #30 | Exceptional 7.7% |
| Native Hawaiians | 100.0 /100 | #31 | Exceptional 7.7% |
| Malaysians | 100.0 /100 | #32 | Exceptional 7.7% |
| Immigrants | Taiwan | 100.0 /100 | #33 | Exceptional 7.7% |
| Immigrants | Vietnam | 100.0 /100 | #34 | Exceptional 7.7% |
| Cherokee | 99.9 /100 | #35 | Exceptional 7.7% |
| Iraqis | 99.9 /100 | #36 | Exceptional 7.7% |
| Basques | 99.9 /100 | #37 | Exceptional 7.8% |
| Creek | 99.9 /100 | #38 | Exceptional 7.8% |
| Immigrants | Fiji | 99.9 /100 | #39 | Exceptional 7.8% |
Demographics Similar to Aleuts by No Vehicles in Household
In terms of no vehicles in household, the demographic groups most similar to Aleuts are Immigrants from Croatia (13.0%, a difference of 0.040%), Immigrants from Southern Europe (13.0%, a difference of 0.080%), Immigrants from Albania (13.0%, a difference of 0.44%), Immigrants from Singapore (12.9%, a difference of 0.62%), and Immigrants from France (12.9%, a difference of 0.66%).
| Demographics | Rating | Rank | No Vehicles in Household |
| Immigrants | Northern Africa | 0.2 /100 | #270 | Tragic 12.6% |
| Immigrants | Morocco | 0.2 /100 | #271 | Tragic 12.6% |
| Bermudans | 0.1 /100 | #272 | Tragic 12.8% |
| Immigrants | France | 0.1 /100 | #273 | Tragic 12.9% |
| Immigrants | Singapore | 0.1 /100 | #274 | Tragic 12.9% |
| Immigrants | Albania | 0.1 /100 | #275 | Tragic 13.0% |
| Immigrants | Southern Europe | 0.1 /100 | #276 | Tragic 13.0% |
| Aleuts | 0.1 /100 | #277 | Tragic 13.0% |
| Immigrants | Croatia | 0.1 /100 | #278 | Tragic 13.0% |
| Mongolians | 0.0 /100 | #279 | Tragic 13.1% |
| Alsatians | 0.0 /100 | #280 | Tragic 13.2% |
| Central American Indians | 0.0 /100 | #281 | Tragic 13.3% |
| Immigrants | Eastern Asia | 0.0 /100 | #282 | Tragic 13.5% |
| Immigrants | Kazakhstan | 0.0 /100 | #283 | Tragic 13.6% |
| Immigrants | Malaysia | 0.0 /100 | #284 | Tragic 13.6% |