Lumbee vs Tsimshian 1 or more Vehicles in Household
COMPARE
Lumbee
Tsimshian
1 or more Vehicles in Household
1 or more Vehicles in Household Comparison
Lumbee
Tsimshian
89.7%
1 OR MORE VEHICLES IN HOUSEHOLD
52.8/ 100
METRIC RATING
173rd/ 347
METRIC RANK
91.4%
1 OR MORE VEHICLES IN HOUSEHOLD
99.3/ 100
METRIC RATING
85th/ 347
METRIC RANK
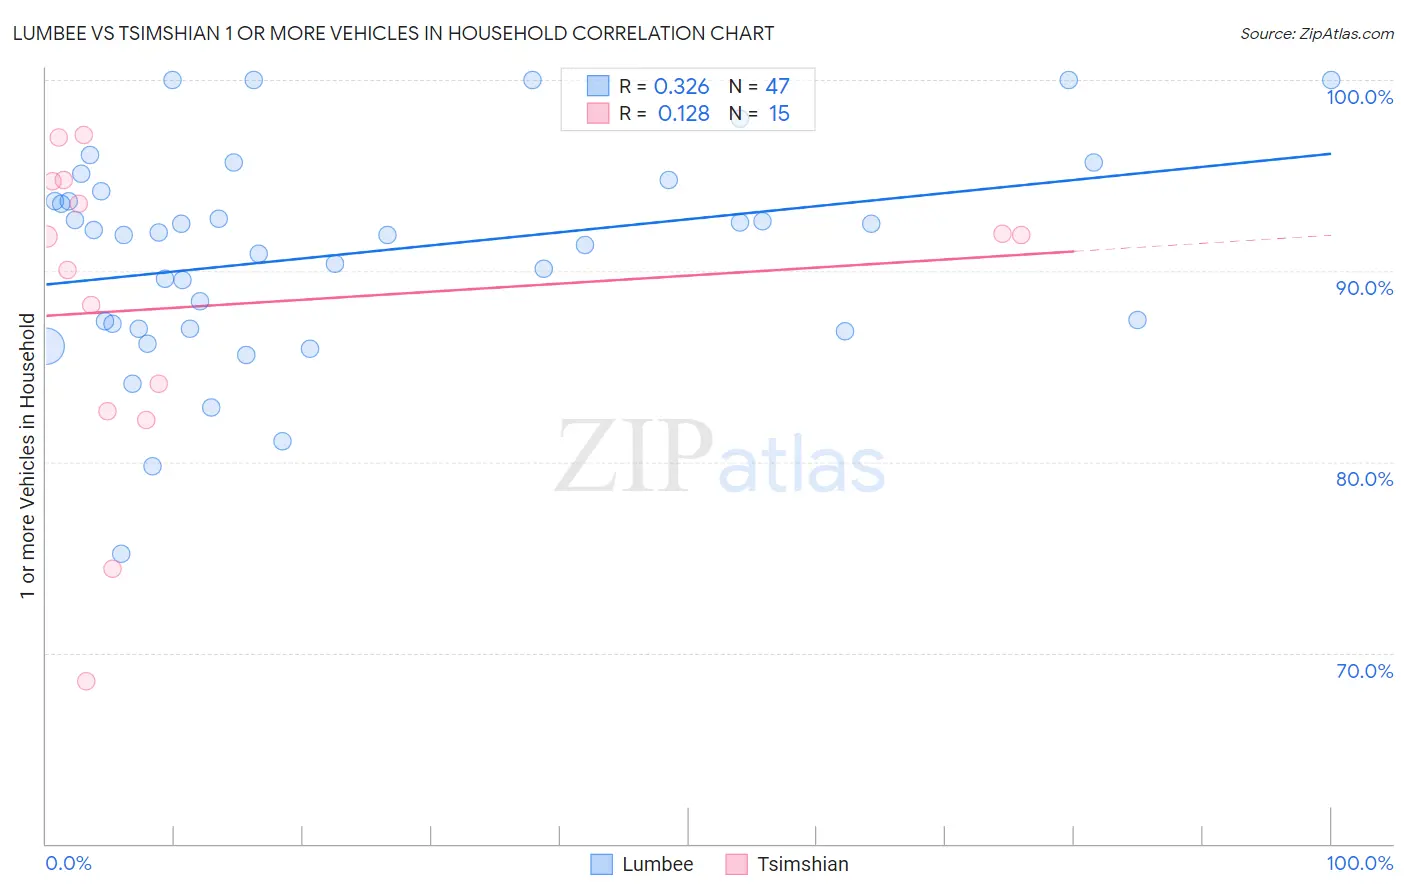
Lumbee vs Tsimshian 1 or more Vehicles in Household Correlation Chart
The statistical analysis conducted on geographies consisting of 92,265,071 people shows a mild positive correlation between the proportion of Lumbee and percentage of households with 1 or more vehicles available in the United States with a correlation coefficient (R) of 0.326 and weighted average of 89.7%. Similarly, the statistical analysis conducted on geographies consisting of 15,626,544 people shows a poor positive correlation between the proportion of Tsimshian and percentage of households with 1 or more vehicles available in the United States with a correlation coefficient (R) of 0.128 and weighted average of 91.4%, a difference of 1.9%.
1 or more Vehicles in Household Correlation Summary
| Measurement | Lumbee | Tsimshian |
| Minimum | 75.2% | 68.5% |
| Maximum | 100.0% | 97.2% |
| Range | 24.8% | 28.6% |
| Mean | 90.9% | 88.2% |
| Median | 91.9% | 91.8% |
| Interquartile 25% (IQ1) | 87.0% | 82.7% |
| Interquartile 75% (IQ3) | 94.2% | 94.7% |
| Interquartile Range (IQR) | 7.2% | 12.0% |
| Standard Deviation (Sample) | 5.5% | 8.4% |
| Standard Deviation (Population) | 5.5% | 8.1% |
Similar Demographics by 1 or more Vehicles in Household
Demographics Similar to Lumbee by 1 or more Vehicles in Household
In terms of 1 or more vehicles in household, the demographic groups most similar to Lumbee are Indonesian (89.7%, a difference of 0.0%), French American Indian (89.8%, a difference of 0.020%), Filipino (89.7%, a difference of 0.040%), Immigrants from Costa Rica (89.8%, a difference of 0.070%), and Immigrants from Burma/Myanmar (89.7%, a difference of 0.080%).
| Demographics | Rating | Rank | 1 or more Vehicles in Household |
| Immigrants | Middle Africa | 62.2 /100 | #166 | Good 89.9% |
| Immigrants | Latin America | 60.3 /100 | #167 | Good 89.8% |
| Immigrants | Cambodia | 60.1 /100 | #168 | Good 89.8% |
| Natives/Alaskans | 59.5 /100 | #169 | Average 89.8% |
| Immigrants | Costa Rica | 57.6 /100 | #170 | Average 89.8% |
| French American Indians | 54.4 /100 | #171 | Average 89.8% |
| Indonesians | 53.0 /100 | #172 | Average 89.7% |
| Lumbee | 52.8 /100 | #173 | Average 89.7% |
| Filipinos | 50.0 /100 | #174 | Average 89.7% |
| Immigrants | Burma/Myanmar | 47.6 /100 | #175 | Average 89.7% |
| Immigrants | Sudan | 47.1 /100 | #176 | Average 89.7% |
| Hmong | 45.8 /100 | #177 | Average 89.6% |
| Immigrants | El Salvador | 44.1 /100 | #178 | Average 89.6% |
| German Russians | 44.0 /100 | #179 | Average 89.6% |
| Arabs | 43.3 /100 | #180 | Average 89.6% |
Demographics Similar to Tsimshian by 1 or more Vehicles in Household
In terms of 1 or more vehicles in household, the demographic groups most similar to Tsimshian are Jordanian (91.4%, a difference of 0.010%), Lebanese (91.4%, a difference of 0.020%), Immigrants from England (91.4%, a difference of 0.020%), Osage (91.4%, a difference of 0.020%), and Immigrants from South Eastern Asia (91.4%, a difference of 0.030%).
| Demographics | Rating | Rank | 1 or more Vehicles in Household |
| Iranians | 99.4 /100 | #78 | Exceptional 91.5% |
| Immigrants | South Central Asia | 99.4 /100 | #79 | Exceptional 91.5% |
| Bolivians | 99.4 /100 | #80 | Exceptional 91.5% |
| Immigrants | South Eastern Asia | 99.3 /100 | #81 | Exceptional 91.4% |
| Lebanese | 99.3 /100 | #82 | Exceptional 91.4% |
| Immigrants | England | 99.3 /100 | #83 | Exceptional 91.4% |
| Jordanians | 99.3 /100 | #84 | Exceptional 91.4% |
| Tsimshian | 99.3 /100 | #85 | Exceptional 91.4% |
| Osage | 99.2 /100 | #86 | Exceptional 91.4% |
| Immigrants | Germany | 99.2 /100 | #87 | Exceptional 91.4% |
| Spanish Americans | 99.2 /100 | #88 | Exceptional 91.4% |
| Bangladeshis | 99.2 /100 | #89 | Exceptional 91.4% |
| Immigrants | Canada | 99.2 /100 | #90 | Exceptional 91.4% |
| Immigrants | Jordan | 99.2 /100 | #91 | Exceptional 91.4% |
| Bhutanese | 99.2 /100 | #92 | Exceptional 91.4% |