Lumbee vs Immigrants from Western Asia 1 or more Vehicles in Household
COMPARE
Lumbee
Immigrants from Western Asia
1 or more Vehicles in Household
1 or more Vehicles in Household Comparison
Lumbee
Immigrants from Western Asia
89.7%
1 OR MORE VEHICLES IN HOUSEHOLD
52.8/ 100
METRIC RATING
173rd/ 347
METRIC RANK
89.0%
1 OR MORE VEHICLES IN HOUSEHOLD
12.3/ 100
METRIC RATING
213th/ 347
METRIC RANK
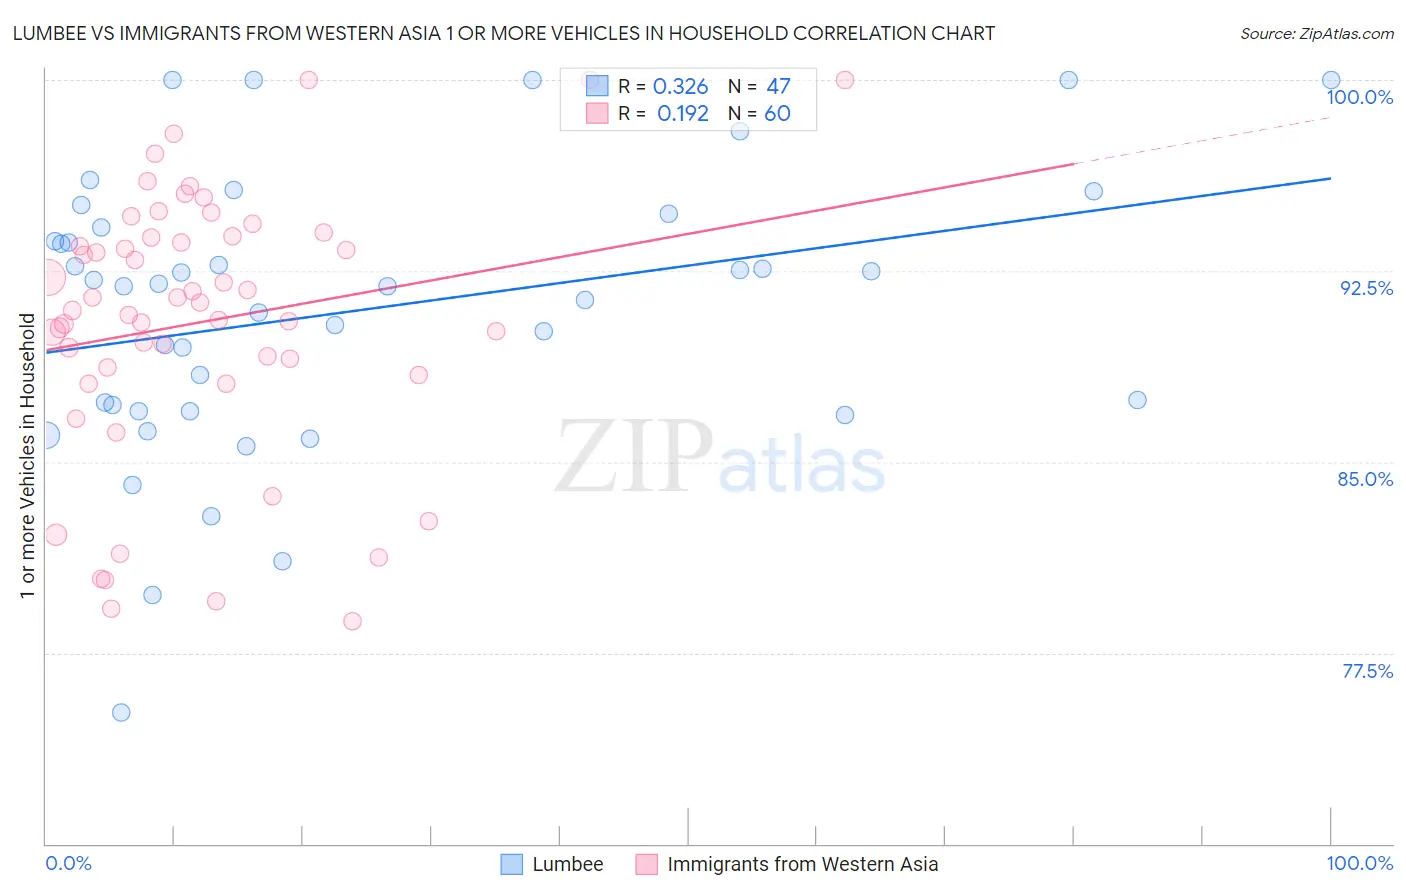
Lumbee vs Immigrants from Western Asia 1 or more Vehicles in Household Correlation Chart
The statistical analysis conducted on geographies consisting of 92,265,071 people shows a mild positive correlation between the proportion of Lumbee and percentage of households with 1 or more vehicles available in the United States with a correlation coefficient (R) of 0.326 and weighted average of 89.7%. Similarly, the statistical analysis conducted on geographies consisting of 404,226,276 people shows a poor positive correlation between the proportion of Immigrants from Western Asia and percentage of households with 1 or more vehicles available in the United States with a correlation coefficient (R) of 0.192 and weighted average of 89.0%, a difference of 0.81%.
1 or more Vehicles in Household Correlation Summary
| Measurement | Lumbee | Immigrants from Western Asia |
| Minimum | 75.2% | 78.8% |
| Maximum | 100.0% | 100.0% |
| Range | 24.8% | 21.2% |
| Mean | 90.9% | 90.5% |
| Median | 91.9% | 91.1% |
| Interquartile 25% (IQ1) | 87.0% | 88.6% |
| Interquartile 75% (IQ3) | 94.2% | 93.8% |
| Interquartile Range (IQR) | 7.2% | 5.3% |
| Standard Deviation (Sample) | 5.5% | 5.3% |
| Standard Deviation (Population) | 5.5% | 5.2% |
Similar Demographics by 1 or more Vehicles in Household
Demographics Similar to Lumbee by 1 or more Vehicles in Household
In terms of 1 or more vehicles in household, the demographic groups most similar to Lumbee are Indonesian (89.7%, a difference of 0.0%), French American Indian (89.8%, a difference of 0.020%), Filipino (89.7%, a difference of 0.040%), Immigrants from Costa Rica (89.8%, a difference of 0.070%), and Immigrants from Burma/Myanmar (89.7%, a difference of 0.080%).
| Demographics | Rating | Rank | 1 or more Vehicles in Household |
| Immigrants | Middle Africa | 62.2 /100 | #166 | Good 89.9% |
| Immigrants | Latin America | 60.3 /100 | #167 | Good 89.8% |
| Immigrants | Cambodia | 60.1 /100 | #168 | Good 89.8% |
| Natives/Alaskans | 59.5 /100 | #169 | Average 89.8% |
| Immigrants | Costa Rica | 57.6 /100 | #170 | Average 89.8% |
| French American Indians | 54.4 /100 | #171 | Average 89.8% |
| Indonesians | 53.0 /100 | #172 | Average 89.7% |
| Lumbee | 52.8 /100 | #173 | Average 89.7% |
| Filipinos | 50.0 /100 | #174 | Average 89.7% |
| Immigrants | Burma/Myanmar | 47.6 /100 | #175 | Average 89.7% |
| Immigrants | Sudan | 47.1 /100 | #176 | Average 89.7% |
| Hmong | 45.8 /100 | #177 | Average 89.6% |
| Immigrants | El Salvador | 44.1 /100 | #178 | Average 89.6% |
| German Russians | 44.0 /100 | #179 | Average 89.6% |
| Arabs | 43.3 /100 | #180 | Average 89.6% |
Demographics Similar to Immigrants from Western Asia by 1 or more Vehicles in Household
In terms of 1 or more vehicles in household, the demographic groups most similar to Immigrants from Western Asia are Immigrants from Hungary (89.0%, a difference of 0.010%), Somali (89.0%, a difference of 0.020%), Sierra Leonean (89.0%, a difference of 0.030%), Dutch West Indian (89.0%, a difference of 0.040%), and Immigrants from Italy (89.1%, a difference of 0.060%).
| Demographics | Rating | Rank | 1 or more Vehicles in Household |
| Apache | 16.2 /100 | #206 | Poor 89.1% |
| Immigrants | Denmark | 14.8 /100 | #207 | Poor 89.1% |
| Immigrants | Chile | 14.4 /100 | #208 | Poor 89.1% |
| Immigrants | Italy | 14.0 /100 | #209 | Poor 89.1% |
| Dutch West Indians | 13.5 /100 | #210 | Poor 89.0% |
| Sierra Leoneans | 13.0 /100 | #211 | Poor 89.0% |
| Somalis | 12.8 /100 | #212 | Poor 89.0% |
| Immigrants | Western Asia | 12.3 /100 | #213 | Poor 89.0% |
| Immigrants | Hungary | 11.9 /100 | #214 | Poor 89.0% |
| Immigrants | Sri Lanka | 10.2 /100 | #215 | Poor 88.9% |
| Immigrants | Argentina | 9.4 /100 | #216 | Tragic 88.9% |
| Argentineans | 8.8 /100 | #217 | Tragic 88.9% |
| Ugandans | 8.7 /100 | #218 | Tragic 88.9% |
| Immigrants | Guatemala | 8.6 /100 | #219 | Tragic 88.9% |
| Immigrants | Zaire | 8.1 /100 | #220 | Tragic 88.8% |