Lithuanian vs Osage 1 or more Vehicles in Household
COMPARE
Lithuanian
Osage
1 or more Vehicles in Household
1 or more Vehicles in Household Comparison
Lithuanians
Osage
91.7%
1 OR MORE VEHICLES IN HOUSEHOLD
99.7/ 100
METRIC RATING
70th/ 347
METRIC RANK
91.4%
1 OR MORE VEHICLES IN HOUSEHOLD
99.2/ 100
METRIC RATING
86th/ 347
METRIC RANK
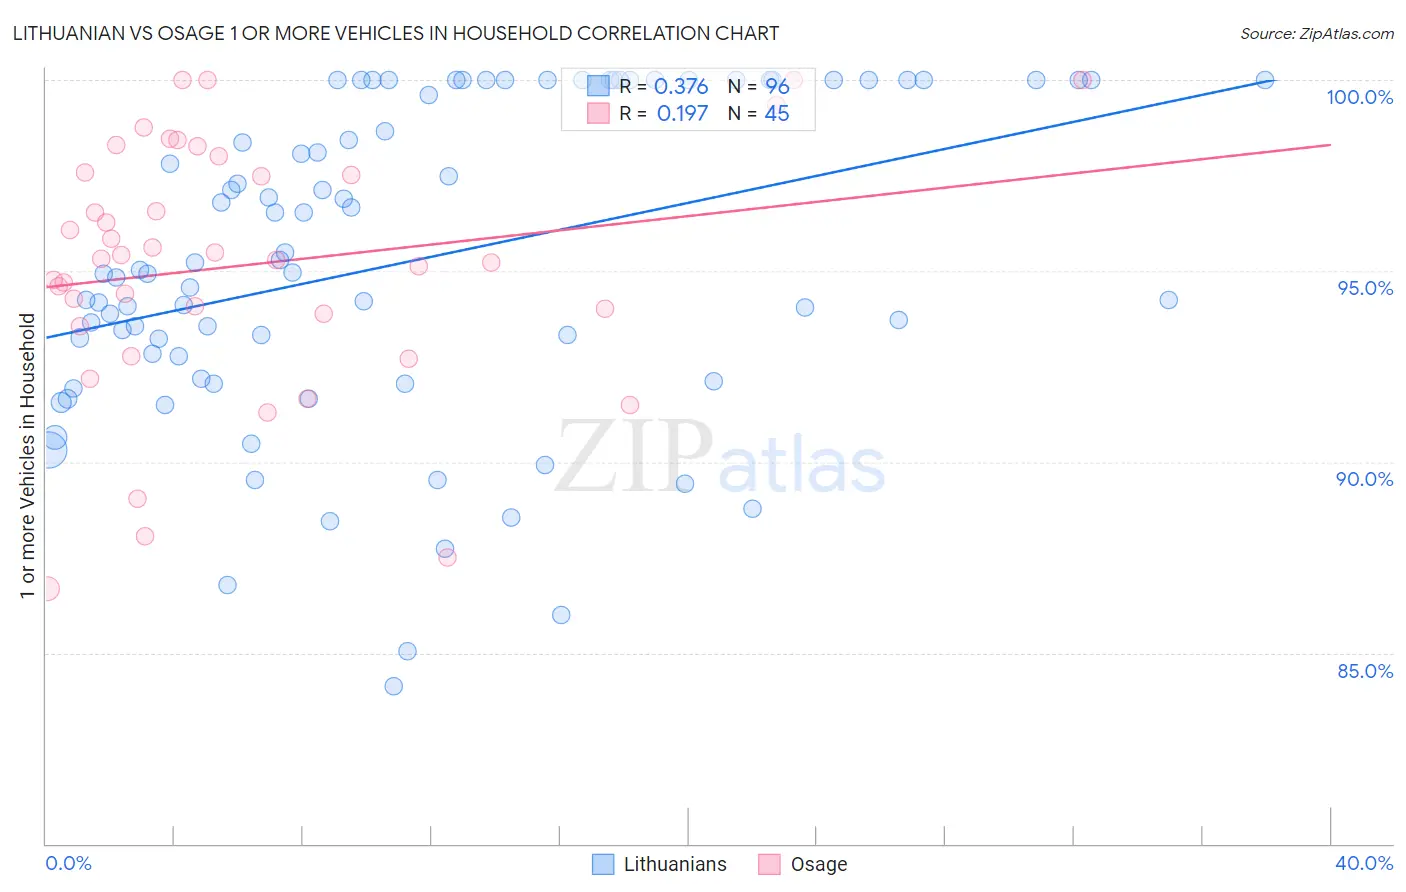
Lithuanian vs Osage 1 or more Vehicles in Household Correlation Chart
The statistical analysis conducted on geographies consisting of 421,786,963 people shows a mild positive correlation between the proportion of Lithuanians and percentage of households with 1 or more vehicles available in the United States with a correlation coefficient (R) of 0.376 and weighted average of 91.7%. Similarly, the statistical analysis conducted on geographies consisting of 91,799,602 people shows a poor positive correlation between the proportion of Osage and percentage of households with 1 or more vehicles available in the United States with a correlation coefficient (R) of 0.197 and weighted average of 91.4%, a difference of 0.33%.
1 or more Vehicles in Household Correlation Summary
| Measurement | Lithuanian | Osage |
| Minimum | 84.1% | 86.7% |
| Maximum | 100.0% | 100.0% |
| Range | 15.9% | 13.3% |
| Mean | 95.3% | 95.2% |
| Median | 95.0% | 95.3% |
| Interquartile 25% (IQ1) | 92.5% | 93.7% |
| Interquartile 75% (IQ3) | 100.0% | 97.8% |
| Interquartile Range (IQR) | 7.5% | 4.1% |
| Standard Deviation (Sample) | 4.2% | 3.3% |
| Standard Deviation (Population) | 4.1% | 3.3% |
Demographics Similar to Lithuanians and Osage by 1 or more Vehicles in Household
In terms of 1 or more vehicles in household, the demographic groups most similar to Lithuanians are Palestinian (91.7%, a difference of 0.020%), Polish (91.7%, a difference of 0.020%), Cajun (91.7%, a difference of 0.020%), Immigrants from Iran (91.7%, a difference of 0.030%), and Immigrants from Scotland (91.8%, a difference of 0.060%). Similarly, the demographic groups most similar to Osage are Immigrants from Germany (91.4%, a difference of 0.010%), Spanish American (91.4%, a difference of 0.010%), Tsimshian (91.4%, a difference of 0.020%), Jordanian (91.4%, a difference of 0.030%), and Immigrants from South Eastern Asia (91.4%, a difference of 0.050%).
| Demographics | Rating | Rank | 1 or more Vehicles in Household |
| Immigrants | Scotland | 99.7 /100 | #68 | Exceptional 91.8% |
| Palestinians | 99.7 /100 | #69 | Exceptional 91.7% |
| Lithuanians | 99.7 /100 | #70 | Exceptional 91.7% |
| Poles | 99.7 /100 | #71 | Exceptional 91.7% |
| Cajuns | 99.7 /100 | #72 | Exceptional 91.7% |
| Immigrants | Iran | 99.7 /100 | #73 | Exceptional 91.7% |
| Immigrants | Lebanon | 99.6 /100 | #74 | Exceptional 91.6% |
| Portuguese | 99.5 /100 | #75 | Exceptional 91.6% |
| Cubans | 99.5 /100 | #76 | Exceptional 91.5% |
| Immigrants | Philippines | 99.4 /100 | #77 | Exceptional 91.5% |
| Iranians | 99.4 /100 | #78 | Exceptional 91.5% |
| Immigrants | South Central Asia | 99.4 /100 | #79 | Exceptional 91.5% |
| Bolivians | 99.4 /100 | #80 | Exceptional 91.5% |
| Immigrants | South Eastern Asia | 99.3 /100 | #81 | Exceptional 91.4% |
| Lebanese | 99.3 /100 | #82 | Exceptional 91.4% |
| Immigrants | England | 99.3 /100 | #83 | Exceptional 91.4% |
| Jordanians | 99.3 /100 | #84 | Exceptional 91.4% |
| Tsimshian | 99.3 /100 | #85 | Exceptional 91.4% |
| Osage | 99.2 /100 | #86 | Exceptional 91.4% |
| Immigrants | Germany | 99.2 /100 | #87 | Exceptional 91.4% |
| Spanish Americans | 99.2 /100 | #88 | Exceptional 91.4% |