Pennsylvania German vs Immigrants from Croatia 1 or more Vehicles in Household
COMPARE
Pennsylvania German
Immigrants from Croatia
1 or more Vehicles in Household
1 or more Vehicles in Household Comparison
Pennsylvania Germans
Immigrants from Croatia
89.3%
1 OR MORE VEHICLES IN HOUSEHOLD
22.9/ 100
METRIC RATING
198th/ 347
METRIC RANK
87.0%
1 OR MORE VEHICLES IN HOUSEHOLD
0.0/ 100
METRIC RATING
280th/ 347
METRIC RANK
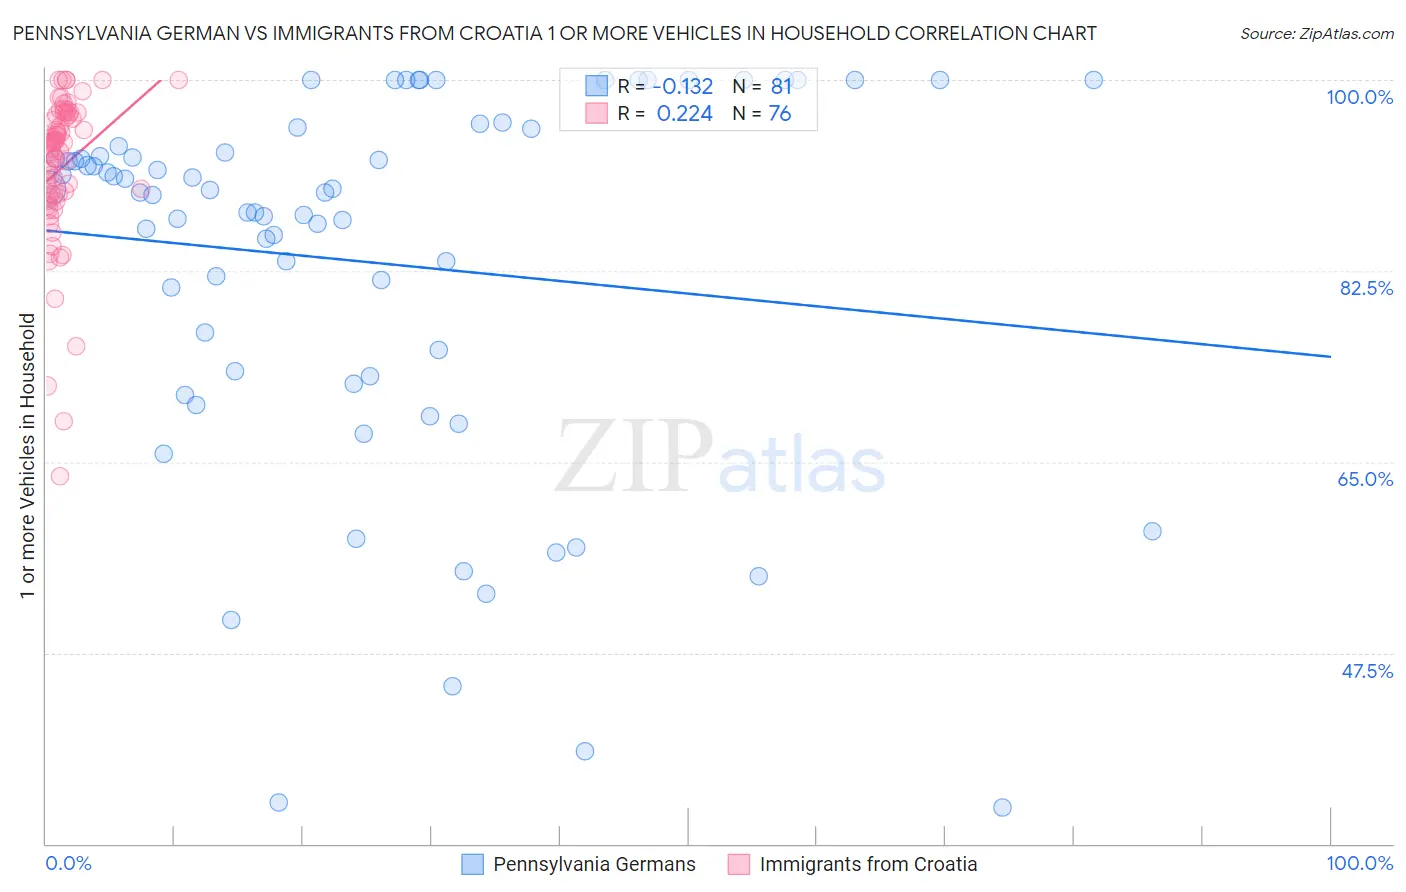
Pennsylvania German vs Immigrants from Croatia 1 or more Vehicles in Household Correlation Chart
The statistical analysis conducted on geographies consisting of 234,072,991 people shows a poor negative correlation between the proportion of Pennsylvania Germans and percentage of households with 1 or more vehicles available in the United States with a correlation coefficient (R) of -0.132 and weighted average of 89.3%. Similarly, the statistical analysis conducted on geographies consisting of 132,537,913 people shows a weak positive correlation between the proportion of Immigrants from Croatia and percentage of households with 1 or more vehicles available in the United States with a correlation coefficient (R) of 0.224 and weighted average of 87.0%, a difference of 2.6%.
1 or more Vehicles in Household Correlation Summary
| Measurement | Pennsylvania German | Immigrants from Croatia |
| Minimum | 33.3% | 63.6% |
| Maximum | 100.0% | 100.0% |
| Range | 66.7% | 36.4% |
| Mean | 83.3% | 91.9% |
| Median | 89.7% | 94.0% |
| Interquartile 25% (IQ1) | 73.1% | 89.4% |
| Interquartile 75% (IQ3) | 94.7% | 96.8% |
| Interquartile Range (IQR) | 21.7% | 7.4% |
| Standard Deviation (Sample) | 17.1% | 7.0% |
| Standard Deviation (Population) | 17.0% | 7.0% |
Similar Demographics by 1 or more Vehicles in Household
Demographics Similar to Pennsylvania Germans by 1 or more Vehicles in Household
In terms of 1 or more vehicles in household, the demographic groups most similar to Pennsylvania Germans are Immigrants from Asia (89.3%, a difference of 0.0%), Immigrants from Sweden (89.3%, a difference of 0.020%), Crow (89.3%, a difference of 0.030%), Central American (89.2%, a difference of 0.040%), and Immigrants from Western Europe (89.2%, a difference of 0.060%).
| Demographics | Rating | Rank | 1 or more Vehicles in Household |
| Immigrants | Poland | 37.1 /100 | #191 | Fair 89.5% |
| Immigrants | North Macedonia | 36.5 /100 | #192 | Fair 89.5% |
| Immigrants | Northern Europe | 35.5 /100 | #193 | Fair 89.5% |
| Immigrants | Eritrea | 33.2 /100 | #194 | Fair 89.4% |
| Immigrants | Armenia | 31.8 /100 | #195 | Fair 89.4% |
| Crow | 24.3 /100 | #196 | Fair 89.3% |
| Immigrants | Sweden | 23.6 /100 | #197 | Fair 89.3% |
| Pennsylvania Germans | 22.9 /100 | #198 | Fair 89.3% |
| Immigrants | Asia | 22.8 /100 | #199 | Fair 89.3% |
| Central Americans | 21.4 /100 | #200 | Fair 89.2% |
| Immigrants | Western Europe | 20.5 /100 | #201 | Fair 89.2% |
| Iroquois | 19.8 /100 | #202 | Poor 89.2% |
| Cambodians | 18.9 /100 | #203 | Poor 89.2% |
| Romanians | 18.2 /100 | #204 | Poor 89.2% |
| Guatemalans | 17.8 /100 | #205 | Poor 89.2% |
Demographics Similar to Immigrants from Croatia by 1 or more Vehicles in Household
In terms of 1 or more vehicles in household, the demographic groups most similar to Immigrants from Croatia are Immigrants from Southern Europe (87.1%, a difference of 0.030%), Immigrants from Albania (87.1%, a difference of 0.030%), Mongolian (87.0%, a difference of 0.060%), Alsatian (87.1%, a difference of 0.070%), and Immigrants from France (87.1%, a difference of 0.13%).
| Demographics | Rating | Rank | 1 or more Vehicles in Household |
| Immigrants | Northern Africa | 0.2 /100 | #273 | Tragic 87.4% |
| Immigrants | Morocco | 0.1 /100 | #274 | Tragic 87.4% |
| Immigrants | Singapore | 0.1 /100 | #275 | Tragic 87.2% |
| Immigrants | France | 0.1 /100 | #276 | Tragic 87.1% |
| Alsatians | 0.1 /100 | #277 | Tragic 87.1% |
| Immigrants | Southern Europe | 0.1 /100 | #278 | Tragic 87.1% |
| Immigrants | Albania | 0.1 /100 | #279 | Tragic 87.1% |
| Immigrants | Croatia | 0.0 /100 | #280 | Tragic 87.0% |
| Mongolians | 0.0 /100 | #281 | Tragic 87.0% |
| Colville | 0.0 /100 | #282 | Tragic 86.8% |
| Immigrants | Eastern Europe | 0.0 /100 | #283 | Tragic 86.7% |
| Central American Indians | 0.0 /100 | #284 | Tragic 86.7% |
| Immigrants | Kazakhstan | 0.0 /100 | #285 | Tragic 86.6% |
| Immigrants | Eastern Asia | 0.0 /100 | #286 | Tragic 86.5% |
| Immigrants | Malaysia | 0.0 /100 | #287 | Tragic 86.5% |