Luxembourger vs Immigrants from Bolivia 2 or more Vehicles in Household
COMPARE
Luxembourger
Immigrants from Bolivia
2 or more Vehicles in Household
2 or more Vehicles in Household Comparison
Luxembourgers
Immigrants from Bolivia
59.1%
2 OR MORE VEHICLES IN HOUSEHOLD
99.9/ 100
METRIC RATING
55th/ 347
METRIC RANK
57.6%
2 OR MORE VEHICLES IN HOUSEHOLD
98.2/ 100
METRIC RATING
102nd/ 347
METRIC RANK
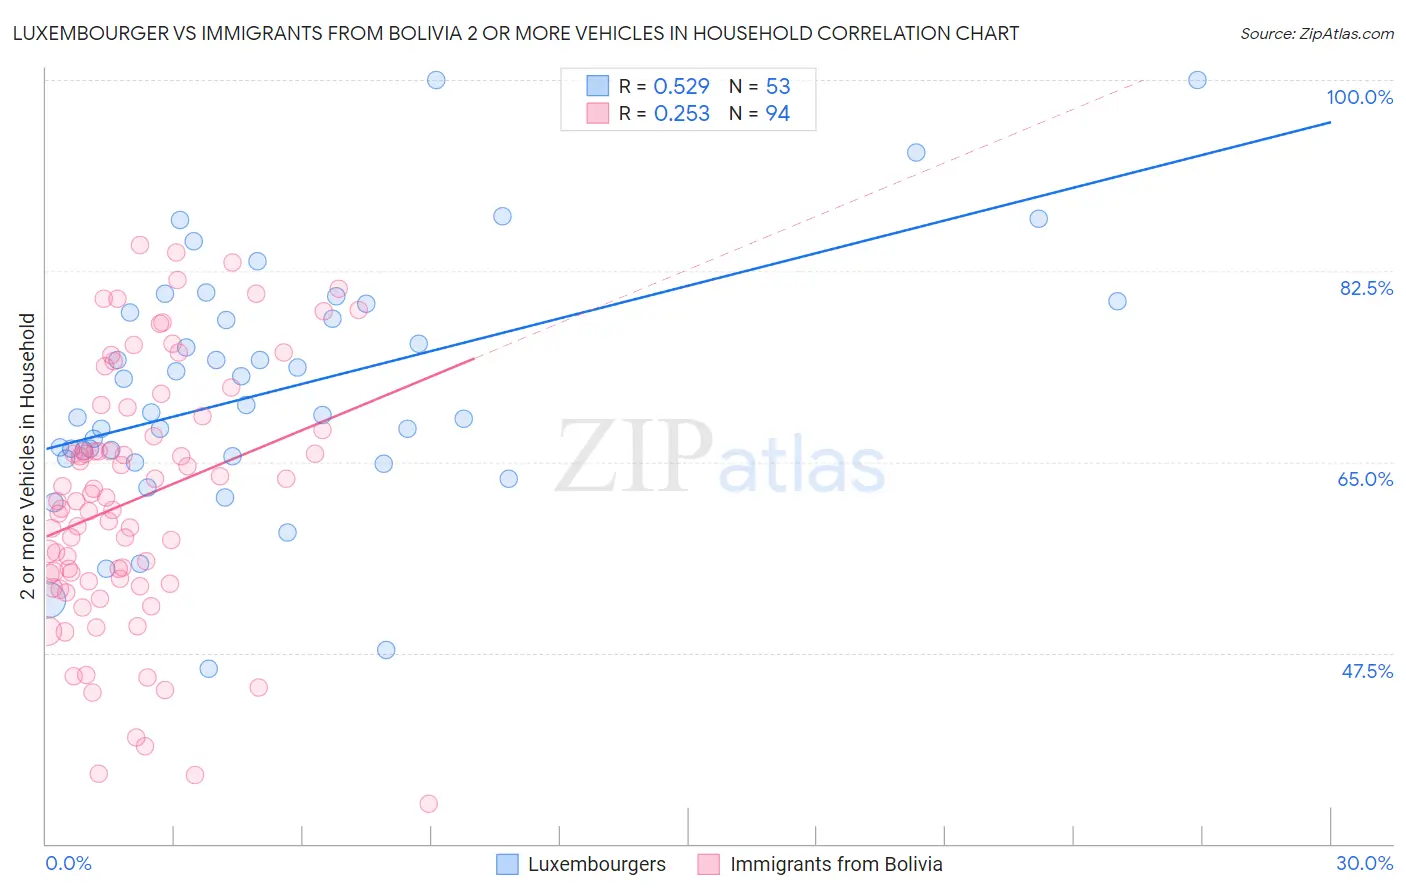
Luxembourger vs Immigrants from Bolivia 2 or more Vehicles in Household Correlation Chart
The statistical analysis conducted on geographies consisting of 144,657,746 people shows a substantial positive correlation between the proportion of Luxembourgers and percentage of households with 2 or more vehicles available in the United States with a correlation coefficient (R) of 0.529 and weighted average of 59.1%. Similarly, the statistical analysis conducted on geographies consisting of 158,713,360 people shows a weak positive correlation between the proportion of Immigrants from Bolivia and percentage of households with 2 or more vehicles available in the United States with a correlation coefficient (R) of 0.253 and weighted average of 57.6%, a difference of 2.6%.
2 or more Vehicles in Household Correlation Summary
| Measurement | Luxembourger | Immigrants from Bolivia |
| Minimum | 46.0% | 33.7% |
| Maximum | 100.0% | 84.8% |
| Range | 54.0% | 51.2% |
| Mean | 71.7% | 61.6% |
| Median | 69.5% | 61.4% |
| Interquartile 25% (IQ1) | 65.4% | 54.1% |
| Interquartile 75% (IQ3) | 79.1% | 69.1% |
| Interquartile Range (IQR) | 13.7% | 15.1% |
| Standard Deviation (Sample) | 11.4% | 11.8% |
| Standard Deviation (Population) | 11.3% | 11.7% |
Similar Demographics by 2 or more Vehicles in Household
Demographics Similar to Luxembourgers by 2 or more Vehicles in Household
In terms of 2 or more vehicles in household, the demographic groups most similar to Luxembourgers are Bhutanese (59.1%, a difference of 0.030%), Chickasaw (59.0%, a difference of 0.11%), Afghan (59.0%, a difference of 0.11%), Celtic (59.2%, a difference of 0.18%), and Spaniard (59.2%, a difference of 0.19%).
| Demographics | Rating | Rank | 2 or more Vehicles in Household |
| Immigrants | India | 99.9 /100 | #48 | Exceptional 59.3% |
| Belgians | 99.9 /100 | #49 | Exceptional 59.3% |
| Choctaw | 99.9 /100 | #50 | Exceptional 59.3% |
| Spaniards | 99.9 /100 | #51 | Exceptional 59.2% |
| Immigrants | Laos | 99.9 /100 | #52 | Exceptional 59.2% |
| Celtics | 99.9 /100 | #53 | Exceptional 59.2% |
| Bhutanese | 99.9 /100 | #54 | Exceptional 59.1% |
| Luxembourgers | 99.9 /100 | #55 | Exceptional 59.1% |
| Chickasaw | 99.9 /100 | #56 | Exceptional 59.0% |
| Afghans | 99.9 /100 | #57 | Exceptional 59.0% |
| Immigrants | Scotland | 99.8 /100 | #58 | Exceptional 58.9% |
| Spanish Americans | 99.8 /100 | #59 | Exceptional 58.9% |
| French Canadians | 99.8 /100 | #60 | Exceptional 58.9% |
| Osage | 99.8 /100 | #61 | Exceptional 58.8% |
| Immigrants | Nonimmigrants | 99.8 /100 | #62 | Exceptional 58.8% |
Demographics Similar to Immigrants from Bolivia by 2 or more Vehicles in Household
In terms of 2 or more vehicles in household, the demographic groups most similar to Immigrants from Bolivia are Jordanian (57.6%, a difference of 0.0%), Immigrants from Indonesia (57.6%, a difference of 0.0%), Immigrants from Korea (57.6%, a difference of 0.010%), Immigrants from Oceania (57.5%, a difference of 0.020%), and Immigrants from Netherlands (57.5%, a difference of 0.040%).
| Demographics | Rating | Rank | 2 or more Vehicles in Household |
| Hmong | 98.9 /100 | #95 | Exceptional 57.8% |
| Burmese | 98.8 /100 | #96 | Exceptional 57.8% |
| Slavs | 98.8 /100 | #97 | Exceptional 57.8% |
| Palestinians | 98.6 /100 | #98 | Exceptional 57.7% |
| Cajuns | 98.5 /100 | #99 | Exceptional 57.7% |
| Fijians | 98.4 /100 | #100 | Exceptional 57.6% |
| Lebanese | 98.3 /100 | #101 | Exceptional 57.6% |
| Immigrants | Bolivia | 98.2 /100 | #102 | Exceptional 57.6% |
| Jordanians | 98.2 /100 | #103 | Exceptional 57.6% |
| Immigrants | Indonesia | 98.2 /100 | #104 | Exceptional 57.6% |
| Immigrants | Korea | 98.2 /100 | #105 | Exceptional 57.6% |
| Immigrants | Oceania | 98.2 /100 | #106 | Exceptional 57.5% |
| Immigrants | Netherlands | 98.2 /100 | #107 | Exceptional 57.5% |
| Immigrants | Canada | 98.1 /100 | #108 | Exceptional 57.5% |
| Immigrants | North America | 98.1 /100 | #109 | Exceptional 57.5% |