Canadian vs Yakama 2 or more Vehicles in Household

COMPARE

Canadian
Race
Ancestry
AfghanAfricanAlaska NativeAlaskan AthabascanAlbanianAleutAlsatianAmericanApacheArabArapahoArgentineanArmenianAssyrian/Chaldean/SyriacAustralianAustrianBahamianBangladeshiBarbadianBasqueBelgianBelizeanBermudanBhutaneseBlackfeetBolivianBrazilianBritishBritish West IndianBulgarianBurmeseCajunCambodianCanadianCape VerdeanCarpatho RusynCelticCentral AmericanCentral American IndianCherokeeCheyenneChickasawChileanChineseChippewaChoctawColombianColvilleComancheCosta RicanCreeCreekCroatianCrowCubanCypriotCzechCzechoslovakianDanishDelawareDominicanDutchDutch West IndianEastern EuropeanEcuadorianEgyptianEnglishEstonianEthiopianEuropeanFijianFilipinoFinnishFrenchFrench American IndianFrench CanadianGermanGerman RussianGhanaianGreekGuamanian/ChamorroGuatemalanGuyaneseHaitianHmongHonduranHopiHoumaHungarianIcelanderIndian (Asian)IndonesianInupiatIranianIraqiIrishIroquoisIsraeliItalianJamaicanJapaneseJordanianKenyanKiowaKoreanLaotianLatvianLebaneseLiberianLithuanianLumbeeLuxembourgerMacedonianMalaysianMalteseMarshalleseMenomineeMexicanMexican American IndianMongolianMoroccanNative HawaiianNavajoNepaleseNew ZealanderNicaraguanNigerianNorthern EuropeanNorwegianOkinawanOsageOttawaPaiutePakistaniPalestinianPanamanianParaguayanPennsylvania GermanPeruvianPimaPolishPortuguesePotawatomiPuebloPuerto RicanPuget Sound SalishRomanianRussianSalvadoranSamoanScandinavianScotch-IrishScottishSeminoleSenegaleseSerbianShoshoneSierra LeoneanSiouxSlavicSlovakSloveneSomaliSouth AfricanSouth AmericanSouth American IndianSoviet UnionSpaniardSpanishSpanish AmericanSpanish American IndianSri LankanSubsaharan AfricanSudaneseSwedishSwissSyrianTaiwaneseThaiTlingit-HaidaTohono O'OdhamTonganTrinidadian and TobagonianTsimshianTurkishU.S. Virgin IslanderUgandanUkrainianUruguayanUteVenezuelanVietnameseWelshWest IndianYaquiYugoslavianYumanYup'ikZimbabwean
Immigration
NonimmigrantsImmigrantsAfghanistanAfricaAlbaniaArgentinaArmeniaAsiaAustraliaAustriaBahamasBangladeshBarbadosBelarusBelgiumBelizeBoliviaBosnia and HerzegovinaBrazilBulgariaBurma/MyanmarCabo VerdeCambodiaCameroonCanadaCaribbeanCentral AmericaChileChinaColombiaCongoCosta RicaCroatiaCubaCzechoslovakiaDenmarkDominicaDominican RepublicEastern AfricaEastern AsiaEastern EuropeEcuadorEgyptEl SalvadorEnglandEritreaEthiopiaEuropeFijiFranceGermanyGhanaGreeceGrenadaGuatemalaGuyanaHaitiHondurasHong KongHungaryIndiaIndonesiaIranIraqIrelandIsraelItalyJamaicaJapanJordanKazakhstanKenyaKoreaKuwaitLaosLatin AmericaLatviaLebanonLiberiaLithuaniaMalaysiaMexicoMicronesiaMiddle AfricaMoldovaMoroccoNepalNetherlandsNicaraguaNigeriaNorth AmericaNorth MacedoniaNorthern AfricaNorthern EuropeNorwayOceaniaPakistanPanamaPeruPhilippinesPolandPortugalRomaniaRussiaSaudi ArabiaScotlandSenegalSerbiaSierra LeoneSingaporeSomaliaSouth AfricaSouth AmericaSouth Central AsiaSouth Eastern AsiaSouthern EuropeSpainSri LankaSt. Vincent and the GrenadinesSudanSwedenSwitzerlandSyriaTaiwanThailandTrinidad and TobagoTurkeyUgandaUkraineUruguayUzbekistanVenezuelaVietnamWest IndiesWestern AfricaWestern AsiaWestern EuropeYemenZaireZimbabweAzores
Yakama
Race
Ancestry
AfghanAfricanAlaska NativeAlaskan AthabascanAlbanianAleutAlsatianAmericanApacheArabArapahoArgentineanArmenianAssyrian/Chaldean/SyriacAustralianAustrianBahamianBangladeshiBarbadianBasqueBelgianBelizeanBermudanBhutaneseBlackfeetBolivianBrazilianBritishBritish West IndianBulgarianBurmeseCajunCambodianCape VerdeanCarpatho RusynCelticCentral AmericanCentral American IndianCherokeeCheyenneChickasawChileanChineseChippewaChoctawColombianColvilleComancheCosta RicanCreeCreekCroatianCrowCubanCypriotCzechCzechoslovakianDanishDelawareDominicanDutchDutch West IndianEastern EuropeanEcuadorianEgyptianEnglishEstonianEthiopianEuropeanFijianFilipinoFinnishFrenchFrench American IndianFrench CanadianGermanGerman RussianGhanaianGreekGuamanian/ChamorroGuatemalanGuyaneseHaitianHmongHonduranHopiHoumaHungarianIcelanderIndian (Asian)IndonesianInupiatIranianIraqiIrishIroquoisIsraeliItalianJamaicanJapaneseJordanianKenyanKiowaKoreanLaotianLatvianLebaneseLiberianLithuanianLumbeeLuxembourgerMacedonianMalaysianMalteseMarshalleseMenomineeMexicanMexican American IndianMongolianMoroccanNative HawaiianNavajoNepaleseNew ZealanderNicaraguanNigerianNorthern EuropeanNorwegianOkinawanOsageOttawaPaiutePakistaniPalestinianPanamanianParaguayanPennsylvania GermanPeruvianPimaPolishPortuguesePotawatomiPuebloPuerto RicanPuget Sound SalishRomanianRussianSalvadoranSamoanScandinavianScotch-IrishScottishSeminoleSenegaleseSerbianShoshoneSierra LeoneanSiouxSlavicSlovakSloveneSomaliSouth AfricanSouth AmericanSouth American IndianSoviet UnionSpaniardSpanishSpanish AmericanSpanish American IndianSri LankanSubsaharan AfricanSudaneseSwedishSwissSyrianTaiwaneseThaiTlingit-HaidaTohono O'OdhamTonganTrinidadian and TobagonianTsimshianTurkishU.S. Virgin IslanderUgandanUkrainianUruguayanUteVenezuelanVietnameseWelshWest IndianYakamaYaquiYugoslavianYumanYup'ikZimbabwean
Immigration
NonimmigrantsImmigrantsAfghanistanAfricaAlbaniaArgentinaArmeniaAsiaAustraliaAustriaBahamasBangladeshBarbadosBelarusBelgiumBelizeBoliviaBosnia and HerzegovinaBrazilBulgariaBurma/MyanmarCabo VerdeCambodiaCameroonCanadaCaribbeanCentral AmericaChileChinaColombiaCongoCosta RicaCroatiaCubaCzechoslovakiaDenmarkDominicaDominican RepublicEastern AfricaEastern AsiaEastern EuropeEcuadorEgyptEl SalvadorEnglandEritreaEthiopiaEuropeFijiFranceGermanyGhanaGreeceGrenadaGuatemalaGuyanaHaitiHondurasHong KongHungaryIndiaIndonesiaIranIraqIrelandIsraelItalyJamaicaJapanJordanKazakhstanKenyaKoreaKuwaitLaosLatin AmericaLatviaLebanonLiberiaLithuaniaMalaysiaMexicoMicronesiaMiddle AfricaMoldovaMoroccoNepalNetherlandsNicaraguaNigeriaNorth AmericaNorth MacedoniaNorthern AfricaNorthern EuropeNorwayOceaniaPakistanPanamaPeruPhilippinesPolandPortugalRomaniaRussiaSaudi ArabiaScotlandSenegalSerbiaSierra LeoneSingaporeSomaliaSouth AfricaSouth AmericaSouth Central AsiaSouth Eastern AsiaSouthern EuropeSpainSri LankaSt. Vincent and the GrenadinesSudanSwedenSwitzerlandSyriaTaiwanThailandTrinidad and TobagoTurkeyUgandaUkraineUruguayUzbekistanVenezuelaVietnamWest IndiesWestern AfricaWestern AsiaWestern EuropeYemenZaireZimbabweAzores
2 or more Vehicles in Household
Income
Poverty
Unemployment
Labor Participation
Family Structure
Vehicle Availability
Education Level
Disability

2 or more Vehicles in Household Comparison

Canadians

Yakama

Exceptional
Exceptional
58.6%
2 OR MORE VEHICLES IN HOUSEHOLD
99.7/ 100
METRIC RATING
68th/ 347
METRIC RANK
64.9%
2 OR MORE VEHICLES IN HOUSEHOLD
100.0/ 100
METRIC RATING
1st/ 347
METRIC RANK

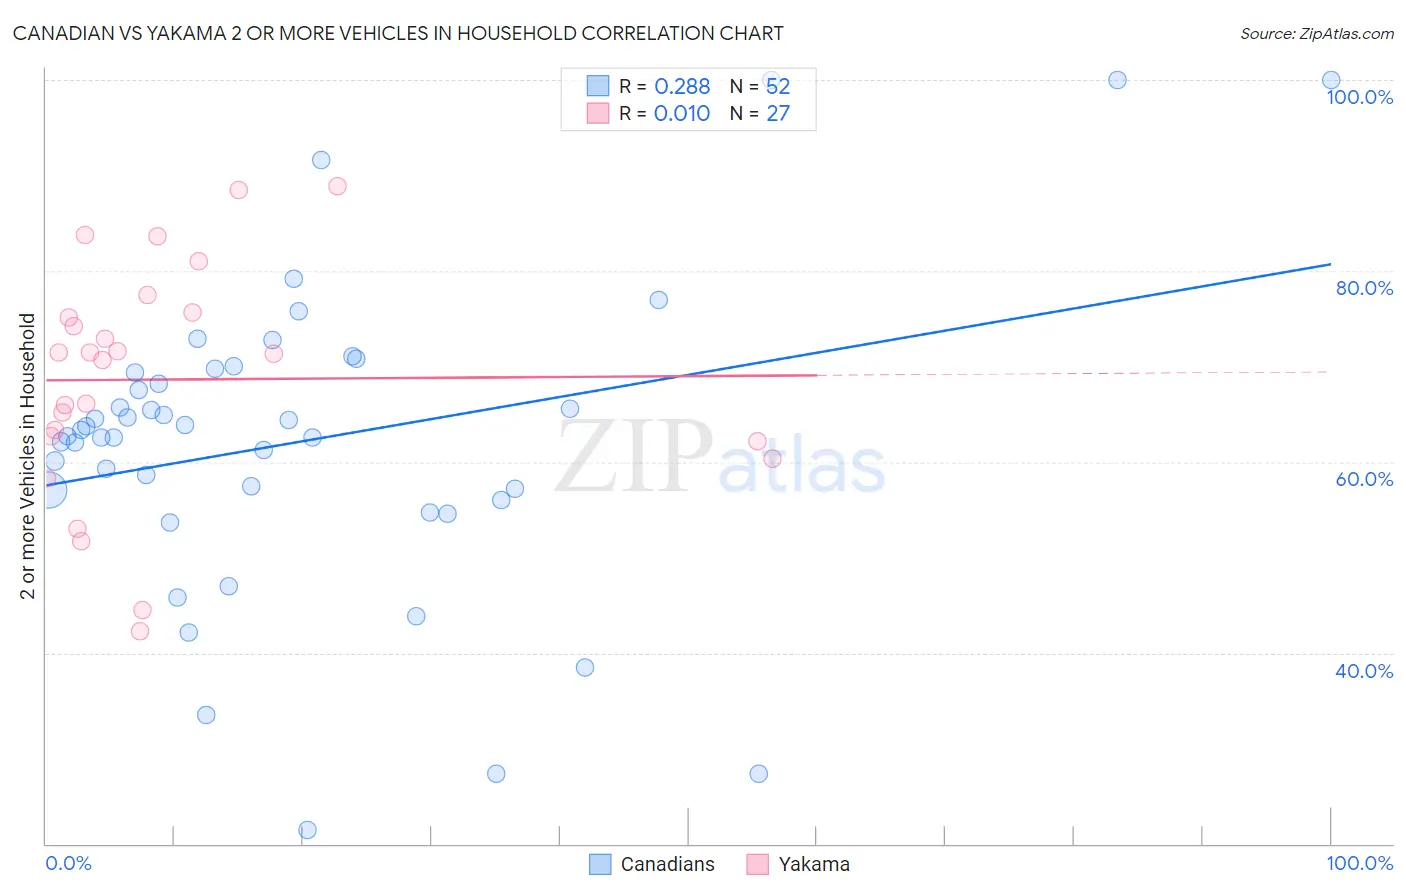
Canadian vs Yakama 2 or more Vehicles in Household Correlation Chart

The statistical analysis conducted on geographies consisting of 437,314,459 people shows a weak positive correlation between the proportion of Canadians and percentage of households with 2 or more vehicles available in the United States with a correlation coefficient (R) of 0.288 and weighted average of 58.6%. Similarly, the statistical analysis conducted on geographies consisting of 19,917,879 people shows no correlation between the proportion of Yakama and percentage of households with 2 or more vehicles available in the United States with a correlation coefficient (R) of 0.010 and weighted average of 64.9%, a difference of 10.8%.
Canadian vs Yakama 2 or more Vehicles in Household

2 or more Vehicles in Household Correlation Summary

MeasurementCanadianYakama
Minimum21.4%42.2%
Maximum100.0%88.9%
Range78.6%46.6%
Mean62.2%68.6%
Median63.0%71.4%
Interquartile 25% (IQ1)56.5%62.1%
Interquartile 75% (IQ3)69.6%75.7%
Interquartile Range (IQR)13.0%13.6%
Standard Deviation (Sample)16.3%12.1%
Standard Deviation (Population)16.2%11.8%

Similar Demographics by 2 or more Vehicles in Household

Demographics Similar to Canadians by 2 or more Vehicles in Household

In terms of 2 or more vehicles in household, the demographic groups most similar to Canadians are Laotian (58.6%, a difference of 0.010%), Croatian (58.6%, a difference of 0.030%), Immigrants from Central America (58.6%, a difference of 0.040%), Portuguese (58.6%, a difference of 0.090%), and Pennsylvania German (58.5%, a difference of 0.12%).
DemographicsRating | Rank2 or more Vehicles in Household
Osage
99.8
/100
|
#61
Exceptional
58.8%
Immigrants | Nonimmigrants
99.8
/100
|
#62
Exceptional
58.8%
Mexican American Indians
99.8
/100
|
#63
Exceptional
58.7%
Portuguese
99.7
/100
|
#64
Exceptional
58.6%
Immigrants | Central America
99.7
/100
|
#65
Exceptional
58.6%
Croatians
99.7
/100
|
#66
Exceptional
58.6%
Laotians
99.7
/100
|
#67
Exceptional
58.6%
Canadians
99.7
/100
|
#68
Exceptional
58.6%
Pennsylvania Germans
99.7
/100
|
#69
Exceptional
58.5%
Italians
99.6
/100
|
#70
Exceptional
58.4%
Bangladeshis
99.6
/100
|
#71
Exceptional
58.4%
Austrians
99.6
/100
|
#72
Exceptional
58.4%
Bolivians
99.6
/100
|
#73
Exceptional
58.3%
Immigrants | Afghanistan
99.6
/100
|
#74
Exceptional
58.3%
Poles
99.5
/100
|
#75
Exceptional
58.3%

Demographics Similar to Yakama by 2 or more Vehicles in Household

In terms of 2 or more vehicles in household, the demographic groups most similar to Yakama are Tongan (63.5%, a difference of 2.2%), Danish (63.3%, a difference of 2.6%), Norwegian (62.8%, a difference of 3.3%), Immigrants from Fiji (62.3%, a difference of 4.2%), and Scandinavian (62.1%, a difference of 4.5%).
DemographicsRating | Rank2 or more Vehicles in Household
Yakama
100.0
/100
|
#1
Exceptional
64.9%
Tongans
100.0
/100
|
#2
Exceptional
63.5%
Danes
100.0
/100
|
#3
Exceptional
63.3%
Norwegians
100.0
/100
|
#4
Exceptional
62.8%
Immigrants | Fiji
100.0
/100
|
#5
Exceptional
62.3%
Scandinavians
100.0
/100
|
#6
Exceptional
62.1%
Puget Sound Salish
100.0
/100
|
#7
Exceptional
62.1%
English
100.0
/100
|
#8
Exceptional
61.9%
Swedes
100.0
/100
|
#9
Exceptional
61.8%
Mexicans
100.0
/100
|
#10
Exceptional
61.7%
Dutch
100.0
/100
|
#11
Exceptional
61.6%
Germans
100.0
/100
|
#12
Exceptional
61.6%
Samoans
100.0
/100
|
#13
Exceptional
61.5%
Czechs
100.0
/100
|
#14
Exceptional
61.5%
Nepalese
100.0
/100
|
#15
Exceptional
61.4%