Japanese vs Immigrants from Barbados Median Household Income
COMPARE
Japanese
Immigrants from Barbados
Median Household Income
Median Household Income Comparison
Japanese
Immigrants from Barbados
$83,395
MEDIAN HOUSEHOLD INCOME
25.1/ 100
METRIC RATING
198th/ 347
METRIC RANK
$78,989
MEDIAN HOUSEHOLD INCOME
1.9/ 100
METRIC RATING
243rd/ 347
METRIC RANK
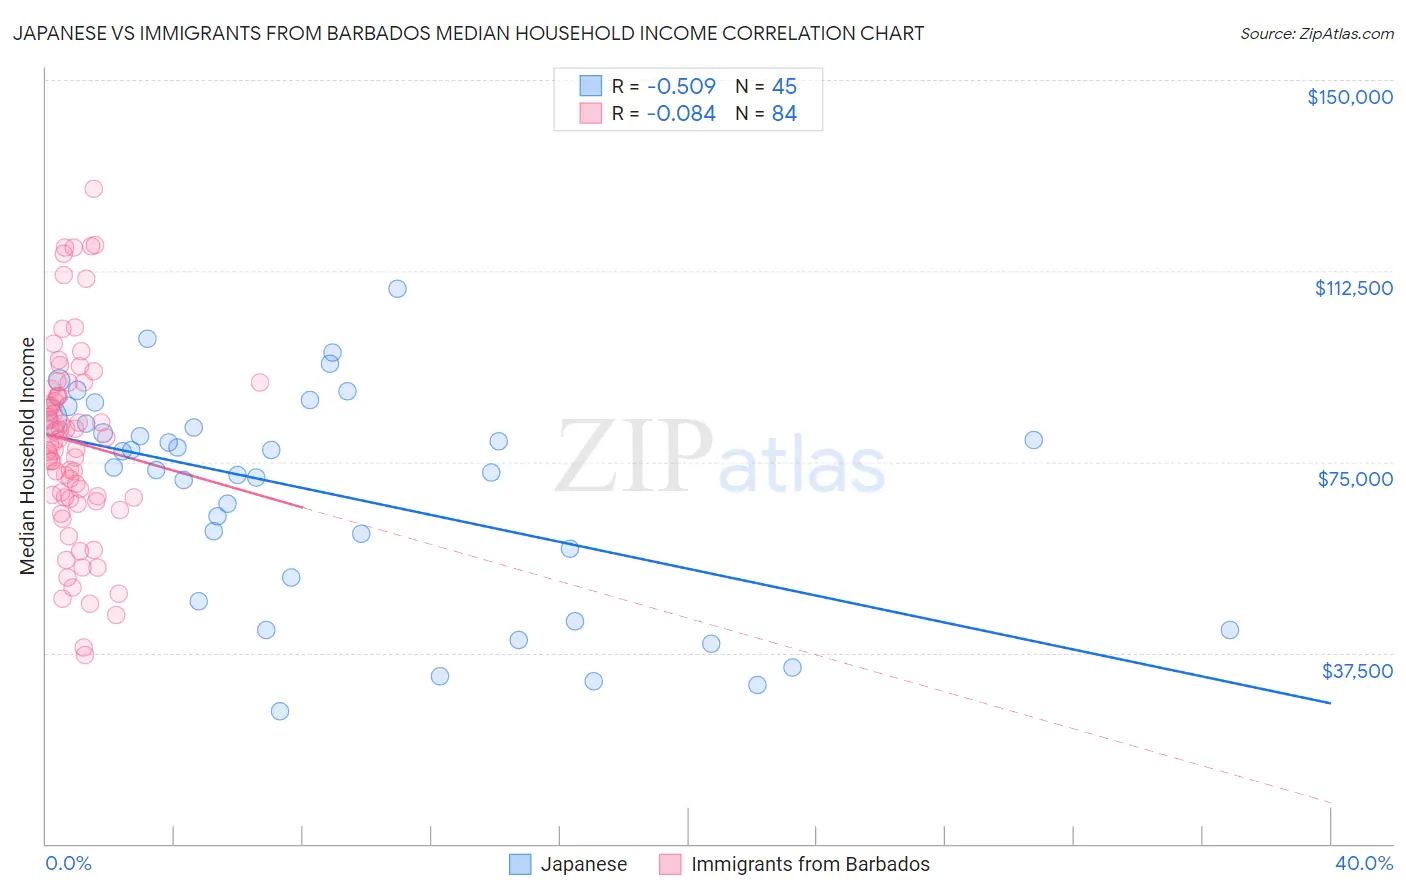
Japanese vs Immigrants from Barbados Median Household Income Correlation Chart
The statistical analysis conducted on geographies consisting of 249,040,762 people shows a substantial negative correlation between the proportion of Japanese and median household income in the United States with a correlation coefficient (R) of -0.509 and weighted average of $83,395. Similarly, the statistical analysis conducted on geographies consisting of 112,738,981 people shows a slight negative correlation between the proportion of Immigrants from Barbados and median household income in the United States with a correlation coefficient (R) of -0.084 and weighted average of $78,989, a difference of 5.6%.
Median Household Income Correlation Summary
| Measurement | Japanese | Immigrants from Barbados |
| Minimum | $25,982 | $37,105 |
| Maximum | $108,958 | $128,750 |
| Range | $82,976 | $91,645 |
| Mean | $68,760 | $78,963 |
| Median | $73,852 | $79,093 |
| Interquartile 25% (IQ1) | $50,038 | $67,974 |
| Interquartile 75% (IQ3) | $83,119 | $88,607 |
| Interquartile Range (IQR) | $33,081 | $20,633 |
| Standard Deviation (Sample) | $21,079 | $18,879 |
| Standard Deviation (Population) | $20,843 | $18,767 |
Similar Demographics by Median Household Income
Demographics Similar to Japanese by Median Household Income
In terms of median household income, the demographic groups most similar to Japanese are German ($83,358, a difference of 0.040%), Aleut ($83,446, a difference of 0.060%), Tsimshian ($83,346, a difference of 0.060%), Spanish ($83,343, a difference of 0.060%), and Immigrants from Thailand ($83,327, a difference of 0.080%).
| Demographics | Rating | Rank | Median Household Income |
| Iraqis | 29.6 /100 | #191 | Fair $83,753 |
| Welsh | 28.0 /100 | #192 | Fair $83,628 |
| Finns | 27.7 /100 | #193 | Fair $83,607 |
| Ghanaians | 27.4 /100 | #194 | Fair $83,582 |
| Immigrants | Armenia | 27.0 /100 | #195 | Fair $83,555 |
| French | 26.0 /100 | #196 | Fair $83,468 |
| Aleuts | 25.7 /100 | #197 | Fair $83,446 |
| Japanese | 25.1 /100 | #198 | Fair $83,395 |
| Germans | 24.6 /100 | #199 | Fair $83,358 |
| Tsimshian | 24.5 /100 | #200 | Fair $83,346 |
| Spanish | 24.4 /100 | #201 | Fair $83,343 |
| Immigrants | Thailand | 24.3 /100 | #202 | Fair $83,327 |
| Immigrants | Cambodia | 24.0 /100 | #203 | Fair $83,304 |
| Immigrants | Africa | 23.8 /100 | #204 | Fair $83,289 |
| Celtics | 22.7 /100 | #205 | Fair $83,193 |
Demographics Similar to Immigrants from Barbados by Median Household Income
In terms of median household income, the demographic groups most similar to Immigrants from Barbados are Marshallese ($78,930, a difference of 0.080%), Immigrants from Sudan ($79,103, a difference of 0.14%), Inupiat ($78,841, a difference of 0.19%), Central American ($78,803, a difference of 0.24%), and Immigrants from Burma/Myanmar ($78,682, a difference of 0.39%).
| Demographics | Rating | Rank | Median Household Income |
| Immigrants | Bosnia and Herzegovina | 3.4 /100 | #236 | Tragic $79,888 |
| Nicaraguans | 3.1 /100 | #237 | Tragic $79,737 |
| Barbadians | 3.0 /100 | #238 | Tragic $79,664 |
| Alaska Natives | 2.7 /100 | #239 | Tragic $79,509 |
| Immigrants | Western Africa | 2.7 /100 | #240 | Tragic $79,490 |
| Immigrants | Nonimmigrants | 2.6 /100 | #241 | Tragic $79,429 |
| Immigrants | Sudan | 2.1 /100 | #242 | Tragic $79,103 |
| Immigrants | Barbados | 1.9 /100 | #243 | Tragic $78,989 |
| Marshallese | 1.9 /100 | #244 | Tragic $78,930 |
| Inupiat | 1.8 /100 | #245 | Tragic $78,841 |
| Central Americans | 1.7 /100 | #246 | Tragic $78,803 |
| Immigrants | Burma/Myanmar | 1.6 /100 | #247 | Tragic $78,682 |
| Sudanese | 1.5 /100 | #248 | Tragic $78,529 |
| West Indians | 1.4 /100 | #249 | Tragic $78,455 |
| Immigrants | Laos | 1.3 /100 | #250 | Tragic $78,327 |