Japanese vs Immigrants from Barbados Unemployment Among Ages 20 to 24 years
COMPARE
Japanese
Immigrants from Barbados
Unemployment Among Ages 20 to 24 years
Unemployment Among Ages 20 to 24 years Comparison
Japanese
Immigrants from Barbados
10.0%
UNEMPLOYMENT AMONG AGES 20 TO 24 YEARS
95.4/ 100
METRIC RATING
98th/ 347
METRIC RANK
13.5%
UNEMPLOYMENT AMONG AGES 20 TO 24 YEARS
0.0/ 100
METRIC RATING
326th/ 347
METRIC RANK
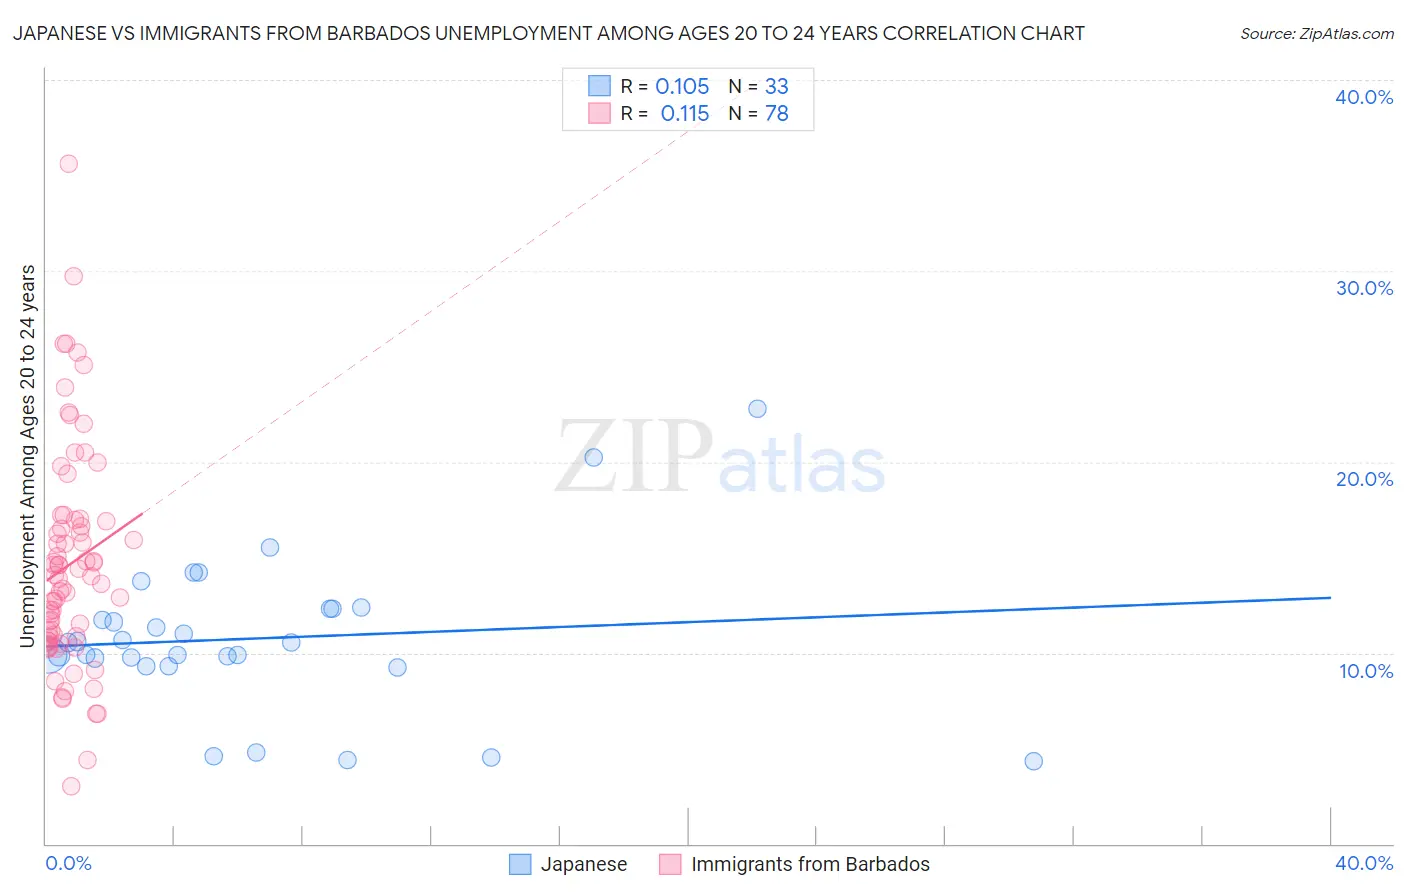
Japanese vs Immigrants from Barbados Unemployment Among Ages 20 to 24 years Correlation Chart
The statistical analysis conducted on geographies consisting of 246,004,323 people shows a poor positive correlation between the proportion of Japanese and unemployment rate among population between the ages 20 and 24 in the United States with a correlation coefficient (R) of 0.105 and weighted average of 10.0%. Similarly, the statistical analysis conducted on geographies consisting of 111,989,452 people shows a poor positive correlation between the proportion of Immigrants from Barbados and unemployment rate among population between the ages 20 and 24 in the United States with a correlation coefficient (R) of 0.115 and weighted average of 13.5%, a difference of 34.4%.
Unemployment Among Ages 20 to 24 years Correlation Summary
| Measurement | Japanese | Immigrants from Barbados |
| Minimum | 4.3% | 3.0% |
| Maximum | 22.8% | 35.6% |
| Range | 18.5% | 32.6% |
| Mean | 10.7% | 14.6% |
| Median | 10.5% | 14.0% |
| Interquartile 25% (IQ1) | 9.5% | 10.8% |
| Interquartile 75% (IQ3) | 12.3% | 16.9% |
| Interquartile Range (IQR) | 2.8% | 6.1% |
| Standard Deviation (Sample) | 4.0% | 5.8% |
| Standard Deviation (Population) | 3.9% | 5.7% |
Similar Demographics by Unemployment Among Ages 20 to 24 years
Demographics Similar to Japanese by Unemployment Among Ages 20 to 24 years
In terms of unemployment among ages 20 to 24 years, the demographic groups most similar to Japanese are Fijian (10.0%, a difference of 0.020%), Immigrants from France (10.0%, a difference of 0.030%), Laotian (10.0%, a difference of 0.060%), Immigrants from Argentina (10.0%, a difference of 0.10%), and Slavic (10.0%, a difference of 0.16%).
| Demographics | Rating | Rank | Unemployment Among Ages 20 to 24 years |
| Bhutanese | 96.9 /100 | #91 | Exceptional 10.0% |
| Bangladeshis | 96.9 /100 | #92 | Exceptional 10.0% |
| Immigrants | Malaysia | 96.9 /100 | #93 | Exceptional 10.0% |
| Immigrants | Micronesia | 96.6 /100 | #94 | Exceptional 10.0% |
| Scotch-Irish | 96.2 /100 | #95 | Exceptional 10.0% |
| Thais | 96.2 /100 | #96 | Exceptional 10.0% |
| Slavs | 96.1 /100 | #97 | Exceptional 10.0% |
| Japanese | 95.4 /100 | #98 | Exceptional 10.0% |
| Fijians | 95.3 /100 | #99 | Exceptional 10.0% |
| Immigrants | France | 95.2 /100 | #100 | Exceptional 10.0% |
| Laotians | 95.1 /100 | #101 | Exceptional 10.0% |
| Immigrants | Argentina | 94.9 /100 | #102 | Exceptional 10.0% |
| Irish | 94.3 /100 | #103 | Exceptional 10.0% |
| Immigrants | Chile | 94.0 /100 | #104 | Exceptional 10.0% |
| Immigrants | Hungary | 94.0 /100 | #105 | Exceptional 10.0% |
Demographics Similar to Immigrants from Barbados by Unemployment Among Ages 20 to 24 years
In terms of unemployment among ages 20 to 24 years, the demographic groups most similar to Immigrants from Barbados are Immigrants from Dominican Republic (13.6%, a difference of 1.3%), Pueblo (13.2%, a difference of 1.7%), British West Indian (13.7%, a difference of 1.8%), Alaska Native (13.2%, a difference of 2.0%), and Dominican (13.8%, a difference of 2.4%).
| Demographics | Rating | Rank | Unemployment Among Ages 20 to 24 years |
| Trinidadians and Tobagonians | 0.0 /100 | #319 | Tragic 12.9% |
| Cheyenne | 0.0 /100 | #320 | Tragic 13.0% |
| Immigrants | Jamaica | 0.0 /100 | #321 | Tragic 13.0% |
| Natives/Alaskans | 0.0 /100 | #322 | Tragic 13.0% |
| Yakama | 0.0 /100 | #323 | Tragic 13.1% |
| Alaska Natives | 0.0 /100 | #324 | Tragic 13.2% |
| Pueblo | 0.0 /100 | #325 | Tragic 13.2% |
| Immigrants | Barbados | 0.0 /100 | #326 | Tragic 13.5% |
| Immigrants | Dominican Republic | 0.0 /100 | #327 | Tragic 13.6% |
| British West Indians | 0.0 /100 | #328 | Tragic 13.7% |
| Dominicans | 0.0 /100 | #329 | Tragic 13.8% |
| Arapaho | 0.0 /100 | #330 | Tragic 13.8% |
| Aleuts | 0.0 /100 | #331 | Tragic 13.8% |
| Immigrants | Grenada | 0.0 /100 | #332 | Tragic 13.8% |
| Immigrants | Guyana | 0.0 /100 | #333 | Tragic 13.9% |