Jamaican vs Immigrants from the Azores Unemployment
COMPARE
Jamaican
Immigrants from the Azores
Unemployment
Unemployment Comparison
Jamaicans
Immigrants from the Azores
6.3%
UNEMPLOYMENT
0.0/ 100
METRIC RATING
297th/ 347
METRIC RANK
6.1%
UNEMPLOYMENT
0.0/ 100
METRIC RATING
282nd/ 347
METRIC RANK
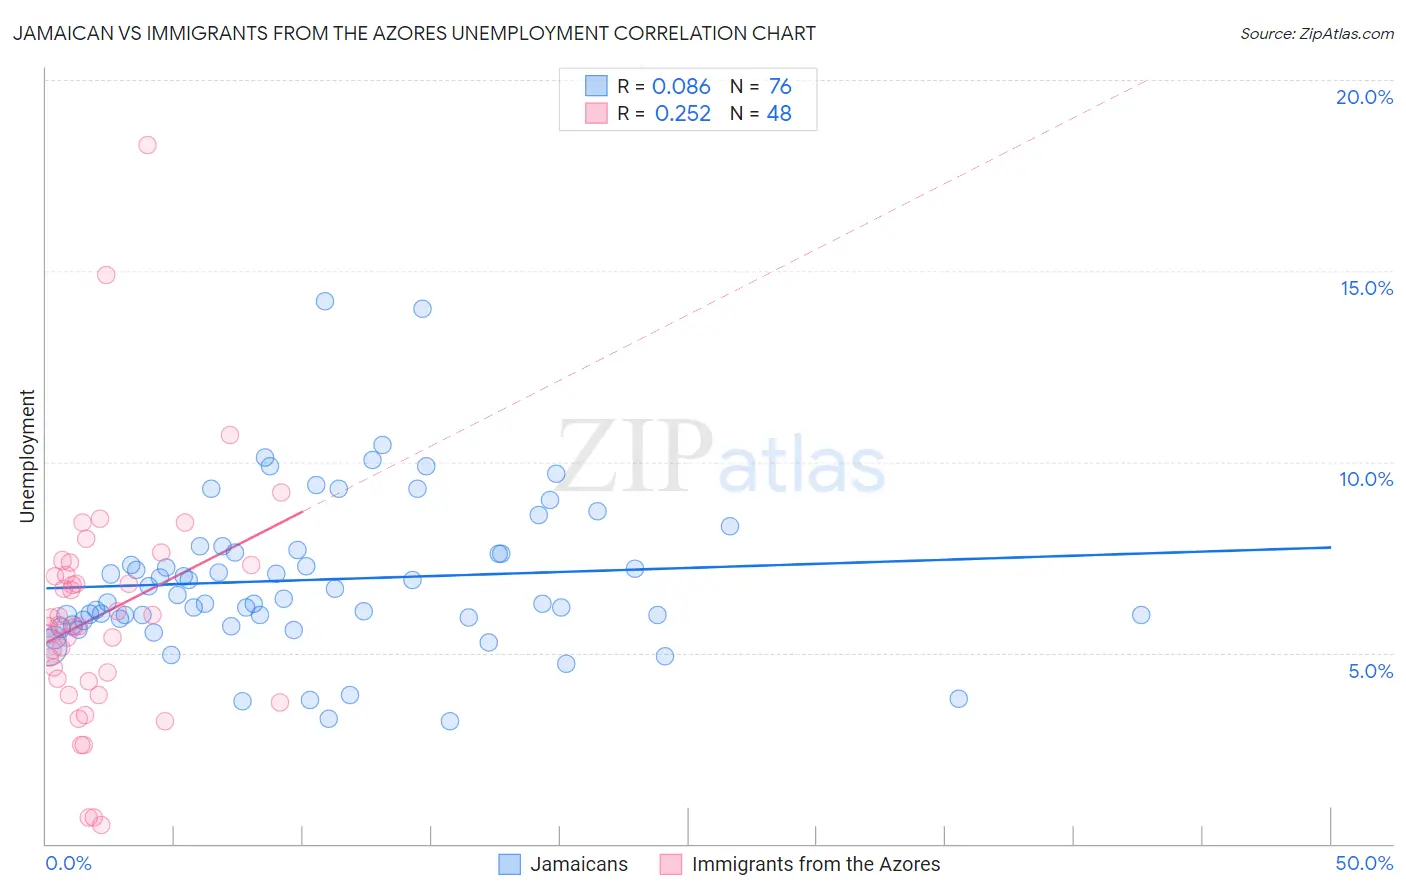
Jamaican vs Immigrants from the Azores Unemployment Correlation Chart
The statistical analysis conducted on geographies consisting of 367,761,379 people shows a slight positive correlation between the proportion of Jamaicans and unemployment in the United States with a correlation coefficient (R) of 0.086 and weighted average of 6.3%. Similarly, the statistical analysis conducted on geographies consisting of 46,243,359 people shows a weak positive correlation between the proportion of Immigrants from the Azores and unemployment in the United States with a correlation coefficient (R) of 0.252 and weighted average of 6.1%, a difference of 4.0%.
Unemployment Correlation Summary
| Measurement | Jamaican | Immigrants from the Azores |
| Minimum | 3.2% | 0.50% |
| Maximum | 14.2% | 18.3% |
| Range | 11.0% | 17.8% |
| Mean | 6.9% | 6.0% |
| Median | 6.4% | 5.7% |
| Interquartile 25% (IQ1) | 5.9% | 4.3% |
| Interquartile 75% (IQ3) | 7.7% | 7.2% |
| Interquartile Range (IQR) | 1.8% | 2.9% |
| Standard Deviation (Sample) | 2.0% | 3.1% |
| Standard Deviation (Population) | 2.0% | 3.1% |
Demographics Similar to Jamaicans and Immigrants from the Azores by Unemployment
In terms of unemployment, the demographic groups most similar to Jamaicans are Immigrants from Haiti (6.3%, a difference of 0.090%), Immigrants from West Indies (6.3%, a difference of 0.14%), Ute (6.3%, a difference of 0.34%), U.S. Virgin Islander (6.3%, a difference of 0.79%), and Immigrants from Ecuador (6.2%, a difference of 0.91%). Similarly, the demographic groups most similar to Immigrants from the Azores are African (6.1%, a difference of 0.060%), Immigrants from Ghana (6.1%, a difference of 0.080%), Aleut (6.1%, a difference of 0.21%), Immigrants from Western Africa (6.0%, a difference of 0.64%), and Immigrants from Mexico (6.0%, a difference of 0.65%).
| Demographics | Rating | Rank | Unemployment |
| Immigrants | Mexico | 0.0 /100 | #279 | Tragic 6.0% |
| Immigrants | Western Africa | 0.0 /100 | #280 | Tragic 6.0% |
| Africans | 0.0 /100 | #281 | Tragic 6.1% |
| Immigrants | Azores | 0.0 /100 | #282 | Tragic 6.1% |
| Immigrants | Ghana | 0.0 /100 | #283 | Tragic 6.1% |
| Aleuts | 0.0 /100 | #284 | Tragic 6.1% |
| Immigrants | Senegal | 0.0 /100 | #285 | Tragic 6.1% |
| Immigrants | Caribbean | 0.0 /100 | #286 | Tragic 6.2% |
| Nepalese | 0.0 /100 | #287 | Tragic 6.2% |
| Ecuadorians | 0.0 /100 | #288 | Tragic 6.2% |
| Chippewa | 0.0 /100 | #289 | Tragic 6.2% |
| Senegalese | 0.0 /100 | #290 | Tragic 6.2% |
| Haitians | 0.0 /100 | #291 | Tragic 6.2% |
| Central American Indians | 0.0 /100 | #292 | Tragic 6.2% |
| Immigrants | Ecuador | 0.0 /100 | #293 | Tragic 6.2% |
| Spanish American Indians | 0.0 /100 | #294 | Tragic 6.2% |
| U.S. Virgin Islanders | 0.0 /100 | #295 | Tragic 6.3% |
| Ute | 0.0 /100 | #296 | Tragic 6.3% |
| Jamaicans | 0.0 /100 | #297 | Tragic 6.3% |
| Immigrants | Haiti | 0.0 /100 | #298 | Tragic 6.3% |
| Immigrants | West Indies | 0.0 /100 | #299 | Tragic 6.3% |