Okinawan vs Immigrants from the Azores 2 or more Vehicles in Household
COMPARE
Okinawan
Immigrants from the Azores
2 or more Vehicles in Household
2 or more Vehicles in Household Comparison
Okinawans
Immigrants from the Azores
51.2%
2 OR MORE VEHICLES IN HOUSEHOLD
0.1/ 100
METRIC RATING
288th/ 347
METRIC RANK
56.4%
2 OR MORE VEHICLES IN HOUSEHOLD
86.6/ 100
METRIC RATING
134th/ 347
METRIC RANK
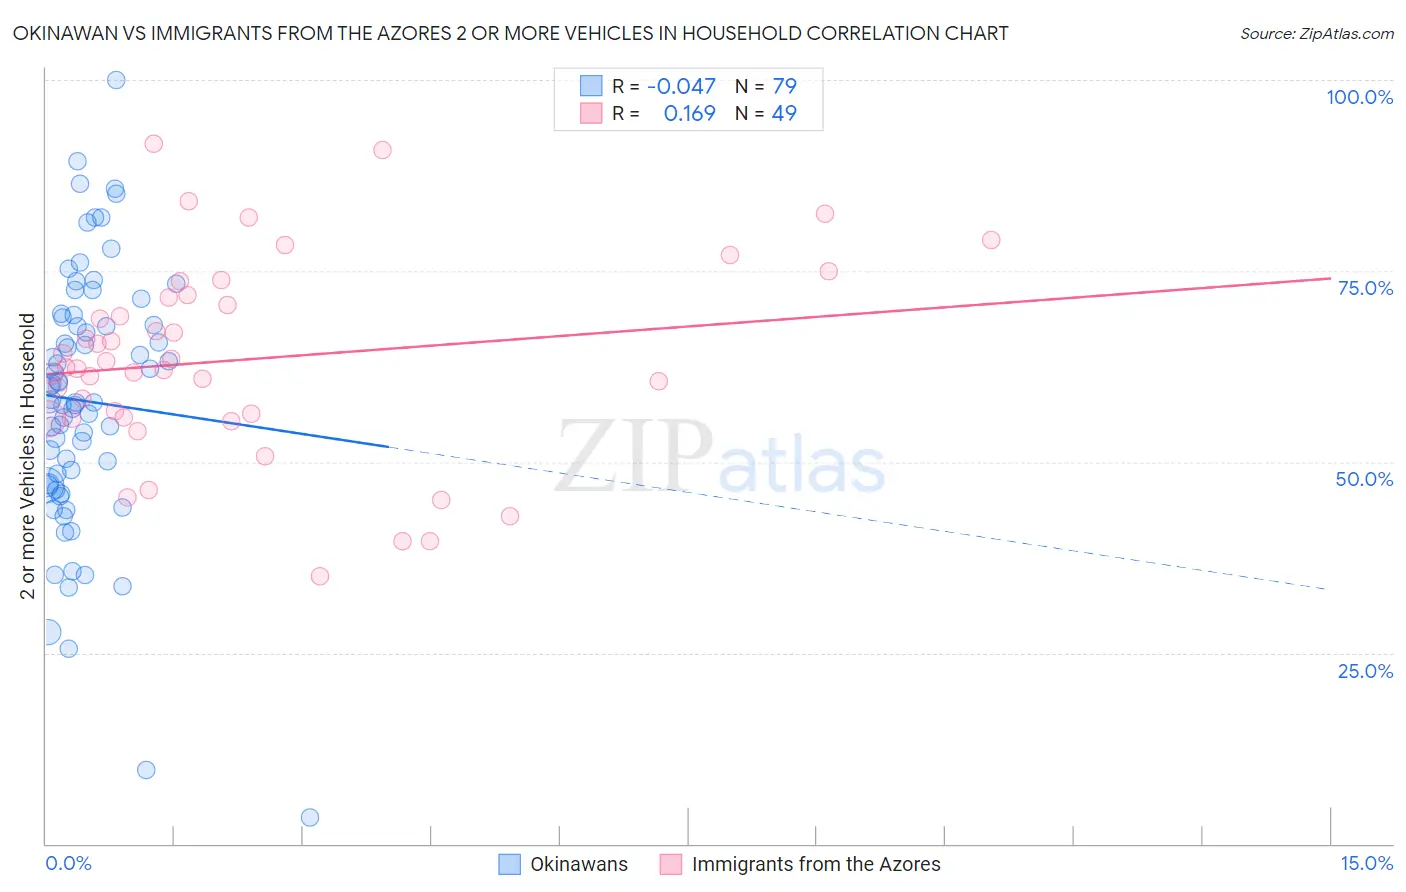
Okinawan vs Immigrants from the Azores 2 or more Vehicles in Household Correlation Chart
The statistical analysis conducted on geographies consisting of 73,742,117 people shows no correlation between the proportion of Okinawans and percentage of households with 2 or more vehicles available in the United States with a correlation coefficient (R) of -0.047 and weighted average of 51.2%. Similarly, the statistical analysis conducted on geographies consisting of 46,257,310 people shows a poor positive correlation between the proportion of Immigrants from the Azores and percentage of households with 2 or more vehicles available in the United States with a correlation coefficient (R) of 0.169 and weighted average of 56.4%, a difference of 10.0%.
2 or more Vehicles in Household Correlation Summary
| Measurement | Okinawan | Immigrants from the Azores |
| Minimum | 3.5% | 35.0% |
| Maximum | 100.0% | 91.6% |
| Range | 96.5% | 56.6% |
| Mean | 58.0% | 63.4% |
| Median | 57.7% | 62.3% |
| Interquartile 25% (IQ1) | 46.9% | 55.7% |
| Interquartile 75% (IQ3) | 68.9% | 71.7% |
| Interquartile Range (IQR) | 22.0% | 15.9% |
| Standard Deviation (Sample) | 17.1% | 12.9% |
| Standard Deviation (Population) | 17.0% | 12.7% |
Similar Demographics by 2 or more Vehicles in Household
Demographics Similar to Okinawans by 2 or more Vehicles in Household
In terms of 2 or more vehicles in household, the demographic groups most similar to Okinawans are Immigrants from Serbia (51.3%, a difference of 0.12%), Immigrants from Liberia (51.3%, a difference of 0.14%), Somali (51.1%, a difference of 0.28%), Immigrants from Uruguay (51.4%, a difference of 0.29%), and Immigrants from Panama (51.1%, a difference of 0.35%).
| Demographics | Rating | Rank | 2 or more Vehicles in Household |
| Immigrants | Kazakhstan | 0.1 /100 | #281 | Tragic 51.6% |
| Bahamians | 0.1 /100 | #282 | Tragic 51.5% |
| Immigrants | China | 0.1 /100 | #283 | Tragic 51.5% |
| Immigrants | Zaire | 0.1 /100 | #284 | Tragic 51.5% |
| Immigrants | Uruguay | 0.1 /100 | #285 | Tragic 51.4% |
| Immigrants | Liberia | 0.1 /100 | #286 | Tragic 51.3% |
| Immigrants | Serbia | 0.1 /100 | #287 | Tragic 51.3% |
| Okinawans | 0.1 /100 | #288 | Tragic 51.2% |
| Somalis | 0.0 /100 | #289 | Tragic 51.1% |
| Immigrants | Panama | 0.0 /100 | #290 | Tragic 51.1% |
| Belizeans | 0.0 /100 | #291 | Tragic 51.0% |
| Immigrants | Ukraine | 0.0 /100 | #292 | Tragic 50.9% |
| Blacks/African Americans | 0.0 /100 | #293 | Tragic 50.9% |
| Bermudans | 0.0 /100 | #294 | Tragic 50.6% |
| Cypriots | 0.0 /100 | #295 | Tragic 50.6% |
Demographics Similar to Immigrants from the Azores by 2 or more Vehicles in Household
In terms of 2 or more vehicles in household, the demographic groups most similar to Immigrants from the Azores are Blackfeet (56.4%, a difference of 0.010%), Immigrants from Asia (56.3%, a difference of 0.050%), Cuban (56.3%, a difference of 0.14%), Salvadoran (56.3%, a difference of 0.15%), and Comanche (56.5%, a difference of 0.16%).
| Demographics | Rating | Rank | 2 or more Vehicles in Household |
| Immigrants | Thailand | 90.7 /100 | #127 | Exceptional 56.6% |
| Immigrants | South Central Asia | 90.5 /100 | #128 | Exceptional 56.6% |
| Ute | 90.4 /100 | #129 | Exceptional 56.6% |
| Yugoslavians | 90.0 /100 | #130 | Exceptional 56.6% |
| Bulgarians | 89.7 /100 | #131 | Excellent 56.5% |
| Hungarians | 89.1 /100 | #132 | Excellent 56.5% |
| Comanche | 88.4 /100 | #133 | Excellent 56.5% |
| Immigrants | Azores | 86.6 /100 | #134 | Excellent 56.4% |
| Blackfeet | 86.5 /100 | #135 | Excellent 56.4% |
| Immigrants | Asia | 86.0 /100 | #136 | Excellent 56.3% |
| Cubans | 84.8 /100 | #137 | Excellent 56.3% |
| Salvadorans | 84.7 /100 | #138 | Excellent 56.3% |
| Armenians | 84.3 /100 | #139 | Excellent 56.3% |
| Latvians | 83.6 /100 | #140 | Excellent 56.2% |
| Immigrants | Cambodia | 83.6 /100 | #141 | Excellent 56.2% |