Marshallese vs Slovak No Vehicles in Household
COMPARE
Marshallese
Slovak
No Vehicles in Household
No Vehicles in Household Comparison
Marshallese
Slovaks
9.8%
NO VEHICLES IN HOUSEHOLD
84.0/ 100
METRIC RATING
139th/ 347
METRIC RANK
8.3%
NO VEHICLES IN HOUSEHOLD
99.8/ 100
METRIC RATING
63rd/ 347
METRIC RANK
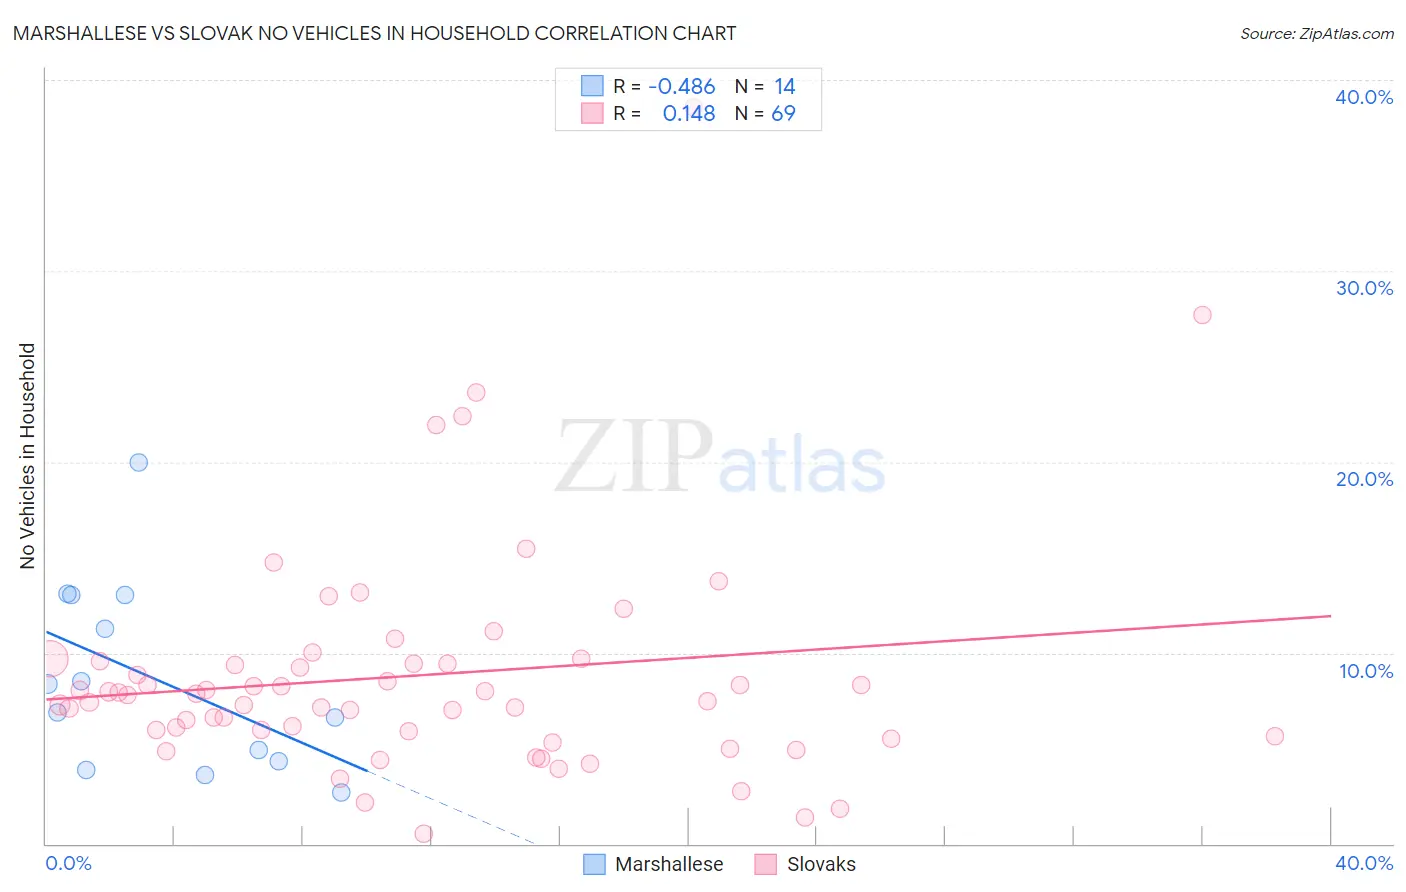
Marshallese vs Slovak No Vehicles in Household Correlation Chart
The statistical analysis conducted on geographies consisting of 14,756,387 people shows a moderate negative correlation between the proportion of Marshallese and percentage of households with no vehicle available in the United States with a correlation coefficient (R) of -0.486 and weighted average of 9.8%. Similarly, the statistical analysis conducted on geographies consisting of 396,581,417 people shows a poor positive correlation between the proportion of Slovaks and percentage of households with no vehicle available in the United States with a correlation coefficient (R) of 0.148 and weighted average of 8.3%, a difference of 19.0%.
No Vehicles in Household Correlation Summary
| Measurement | Marshallese | Slovak |
| Minimum | 2.7% | 0.53% |
| Maximum | 20.0% | 38.6% |
| Range | 17.3% | 38.0% |
| Mean | 8.6% | 8.8% |
| Median | 7.6% | 7.8% |
| Interquartile 25% (IQ1) | 4.3% | 5.8% |
| Interquartile 75% (IQ3) | 13.0% | 9.5% |
| Interquartile Range (IQR) | 8.7% | 3.8% |
| Standard Deviation (Sample) | 4.9% | 6.1% |
| Standard Deviation (Population) | 4.8% | 6.1% |
Similar Demographics by No Vehicles in Household
Demographics Similar to Marshallese by No Vehicles in Household
In terms of no vehicles in household, the demographic groups most similar to Marshallese are Immigrants from Lithuania (9.8%, a difference of 0.010%), Estonian (9.8%, a difference of 0.050%), Immigrants from Moldova (9.8%, a difference of 0.16%), Sudanese (9.8%, a difference of 0.23%), and Immigrants from South Africa (9.8%, a difference of 0.26%).
| Demographics | Rating | Rank | No Vehicles in Household |
| Kenyans | 88.0 /100 | #132 | Excellent 9.7% |
| Immigrants | Oceania | 87.1 /100 | #133 | Excellent 9.7% |
| Syrians | 87.1 /100 | #134 | Excellent 9.7% |
| Latvians | 85.1 /100 | #135 | Excellent 9.8% |
| Immigrants | South Africa | 85.0 /100 | #136 | Excellent 9.8% |
| Immigrants | Moldova | 84.6 /100 | #137 | Excellent 9.8% |
| Estonians | 84.2 /100 | #138 | Excellent 9.8% |
| Marshallese | 84.0 /100 | #139 | Excellent 9.8% |
| Immigrants | Lithuania | 84.0 /100 | #140 | Excellent 9.8% |
| Sudanese | 83.1 /100 | #141 | Excellent 9.8% |
| Immigrants | Zimbabwe | 82.6 /100 | #142 | Excellent 9.9% |
| Chileans | 81.2 /100 | #143 | Excellent 9.9% |
| Immigrants | Bahamas | 81.2 /100 | #144 | Excellent 9.9% |
| Bahamians | 81.0 /100 | #145 | Excellent 9.9% |
| Hungarians | 80.0 /100 | #146 | Excellent 9.9% |
Demographics Similar to Slovaks by No Vehicles in Household
In terms of no vehicles in household, the demographic groups most similar to Slovaks are Croatian (8.3%, a difference of 0.090%), Chinese (8.2%, a difference of 0.38%), Thai (8.2%, a difference of 0.84%), Canadian (8.3%, a difference of 0.84%), and Palestinian (8.3%, a difference of 0.95%).
| Demographics | Rating | Rank | No Vehicles in Household |
| Immigrants | Afghanistan | 99.9 /100 | #56 | Exceptional 8.1% |
| Venezuelans | 99.8 /100 | #57 | Exceptional 8.1% |
| Immigrants | Mexico | 99.8 /100 | #58 | Exceptional 8.1% |
| Immigrants | India | 99.8 /100 | #59 | Exceptional 8.2% |
| Immigrants | Laos | 99.8 /100 | #60 | Exceptional 8.2% |
| Thais | 99.8 /100 | #61 | Exceptional 8.2% |
| Chinese | 99.8 /100 | #62 | Exceptional 8.2% |
| Slovaks | 99.8 /100 | #63 | Exceptional 8.3% |
| Croatians | 99.8 /100 | #64 | Exceptional 8.3% |
| Canadians | 99.7 /100 | #65 | Exceptional 8.3% |
| Palestinians | 99.7 /100 | #66 | Exceptional 8.3% |
| Immigrants | Scotland | 99.7 /100 | #67 | Exceptional 8.3% |
| Immigrants | Iran | 99.7 /100 | #68 | Exceptional 8.4% |
| Spaniards | 99.7 /100 | #69 | Exceptional 8.4% |
| Cajuns | 99.6 /100 | #70 | Exceptional 8.4% |