Immigrants vs Slovak No Vehicles in Household
COMPARE
Immigrants
Slovak
No Vehicles in Household
No Vehicles in Household Comparison
Immigrants
Slovaks
11.7%
NO VEHICLES IN HOUSEHOLD
2.7/ 100
METRIC RATING
240th/ 347
METRIC RANK
8.3%
NO VEHICLES IN HOUSEHOLD
99.8/ 100
METRIC RATING
63rd/ 347
METRIC RANK
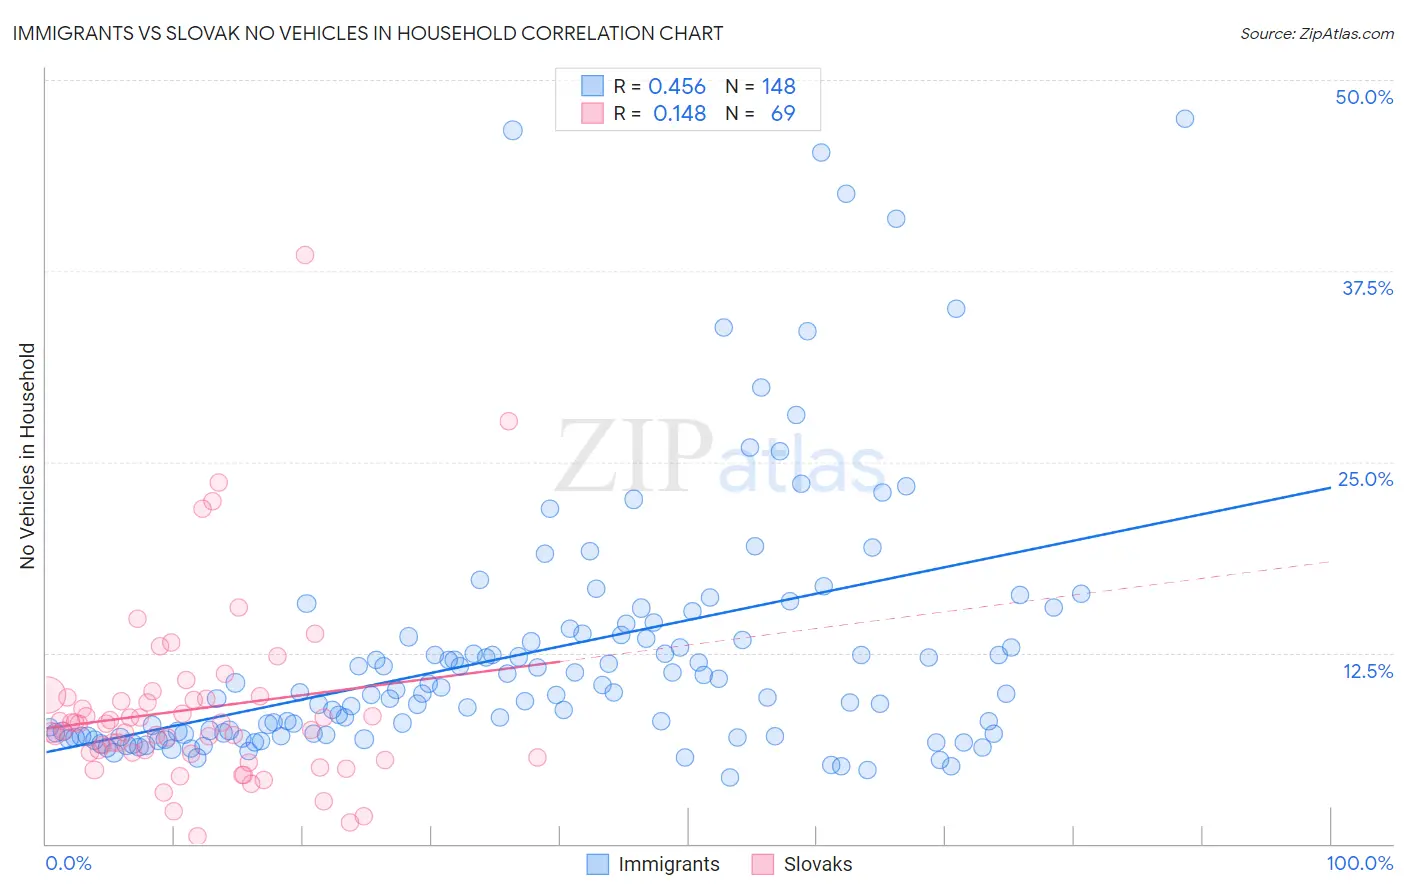
Immigrants vs Slovak No Vehicles in Household Correlation Chart
The statistical analysis conducted on geographies consisting of 571,687,652 people shows a moderate positive correlation between the proportion of Immigrants and percentage of households with no vehicle available in the United States with a correlation coefficient (R) of 0.456 and weighted average of 11.7%. Similarly, the statistical analysis conducted on geographies consisting of 396,581,417 people shows a poor positive correlation between the proportion of Slovaks and percentage of households with no vehicle available in the United States with a correlation coefficient (R) of 0.148 and weighted average of 8.3%, a difference of 41.3%.
No Vehicles in Household Correlation Summary
| Measurement | Immigrants | Slovak |
| Minimum | 4.3% | 0.53% |
| Maximum | 47.4% | 38.6% |
| Range | 43.1% | 38.0% |
| Mean | 12.5% | 8.8% |
| Median | 9.8% | 7.8% |
| Interquartile 25% (IQ1) | 7.1% | 5.8% |
| Interquartile 75% (IQ3) | 13.6% | 9.5% |
| Interquartile Range (IQR) | 6.5% | 3.8% |
| Standard Deviation (Sample) | 8.5% | 6.1% |
| Standard Deviation (Population) | 8.4% | 6.1% |
Similar Demographics by No Vehicles in Household
Demographics Similar to Immigrants by No Vehicles in Household
In terms of no vehicles in household, the demographic groups most similar to Immigrants are Eastern European (11.7%, a difference of 0.010%), Taiwanese (11.7%, a difference of 0.060%), Turkish (11.7%, a difference of 0.12%), Cheyenne (11.7%, a difference of 0.45%), and Russian (11.6%, a difference of 0.52%).
| Demographics | Rating | Rank | No Vehicles in Household |
| Houma | 4.7 /100 | #233 | Tragic 11.5% |
| Immigrants | Peru | 4.5 /100 | #234 | Tragic 11.5% |
| Kiowa | 4.0 /100 | #235 | Tragic 11.5% |
| Cree | 3.5 /100 | #236 | Tragic 11.6% |
| Ute | 3.3 /100 | #237 | Tragic 11.6% |
| Russians | 3.2 /100 | #238 | Tragic 11.6% |
| Taiwanese | 2.8 /100 | #239 | Tragic 11.7% |
| Immigrants | Immigrants | 2.7 /100 | #240 | Tragic 11.7% |
| Eastern Europeans | 2.7 /100 | #241 | Tragic 11.7% |
| Turks | 2.6 /100 | #242 | Tragic 11.7% |
| Cheyenne | 2.4 /100 | #243 | Tragic 11.7% |
| Immigrants | Portugal | 2.2 /100 | #244 | Tragic 11.7% |
| Immigrants | Honduras | 2.1 /100 | #245 | Tragic 11.8% |
| Menominee | 2.0 /100 | #246 | Tragic 11.8% |
| Immigrants | Czechoslovakia | 2.0 /100 | #247 | Tragic 11.8% |
Demographics Similar to Slovaks by No Vehicles in Household
In terms of no vehicles in household, the demographic groups most similar to Slovaks are Croatian (8.3%, a difference of 0.090%), Chinese (8.2%, a difference of 0.38%), Thai (8.2%, a difference of 0.84%), Canadian (8.3%, a difference of 0.84%), and Palestinian (8.3%, a difference of 0.95%).
| Demographics | Rating | Rank | No Vehicles in Household |
| Immigrants | Afghanistan | 99.9 /100 | #56 | Exceptional 8.1% |
| Venezuelans | 99.8 /100 | #57 | Exceptional 8.1% |
| Immigrants | Mexico | 99.8 /100 | #58 | Exceptional 8.1% |
| Immigrants | India | 99.8 /100 | #59 | Exceptional 8.2% |
| Immigrants | Laos | 99.8 /100 | #60 | Exceptional 8.2% |
| Thais | 99.8 /100 | #61 | Exceptional 8.2% |
| Chinese | 99.8 /100 | #62 | Exceptional 8.2% |
| Slovaks | 99.8 /100 | #63 | Exceptional 8.3% |
| Croatians | 99.8 /100 | #64 | Exceptional 8.3% |
| Canadians | 99.7 /100 | #65 | Exceptional 8.3% |
| Palestinians | 99.7 /100 | #66 | Exceptional 8.3% |
| Immigrants | Scotland | 99.7 /100 | #67 | Exceptional 8.3% |
| Immigrants | Iran | 99.7 /100 | #68 | Exceptional 8.4% |
| Spaniards | 99.7 /100 | #69 | Exceptional 8.4% |
| Cajuns | 99.6 /100 | #70 | Exceptional 8.4% |