Italian vs Slovak High School Diploma
COMPARE
Italian
Slovak
High School Diploma
High School Diploma Comparison
Italians
Slovaks
91.5%
HIGH SCHOOL DIPLOMA
99.9/ 100
METRIC RATING
24th/ 347
METRIC RANK
92.0%
HIGH SCHOOL DIPLOMA
100.0/ 100
METRIC RATING
6th/ 347
METRIC RANK
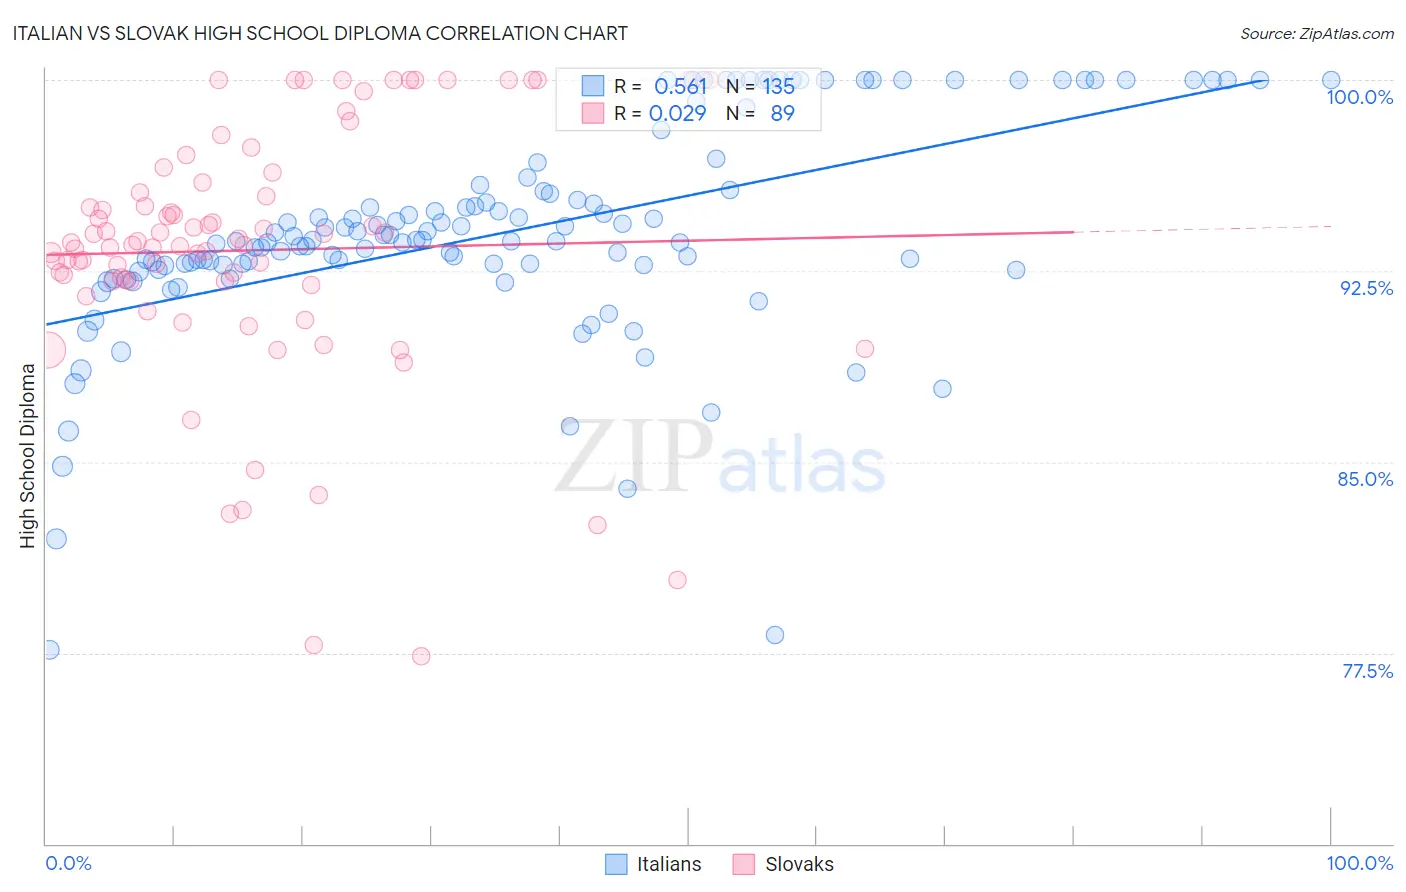
Italian vs Slovak High School Diploma Correlation Chart
The statistical analysis conducted on geographies consisting of 575,116,589 people shows a substantial positive correlation between the proportion of Italians and percentage of population with at least high school diploma education in the United States with a correlation coefficient (R) of 0.561 and weighted average of 91.5%. Similarly, the statistical analysis conducted on geographies consisting of 397,891,887 people shows no correlation between the proportion of Slovaks and percentage of population with at least high school diploma education in the United States with a correlation coefficient (R) of 0.029 and weighted average of 92.0%, a difference of 0.53%.
High School Diploma Correlation Summary
| Measurement | Italian | Slovak |
| Minimum | 77.6% | 77.3% |
| Maximum | 100.0% | 100.0% |
| Range | 22.4% | 22.7% |
| Mean | 94.0% | 93.3% |
| Median | 93.7% | 93.5% |
| Interquartile 25% (IQ1) | 92.7% | 92.1% |
| Interquartile 75% (IQ3) | 95.7% | 95.8% |
| Interquartile Range (IQR) | 2.9% | 3.7% |
| Standard Deviation (Sample) | 4.2% | 4.9% |
| Standard Deviation (Population) | 4.2% | 4.9% |
Demographics Similar to Italians and Slovaks by High School Diploma
In terms of high school diploma, the demographic groups most similar to Italians are Scandinavian (91.5%, a difference of 0.0%), Thai (91.5%, a difference of 0.0%), Estonian (91.6%, a difference of 0.030%), Filipino (91.6%, a difference of 0.040%), and Czech (91.6%, a difference of 0.050%). Similarly, the demographic groups most similar to Slovaks are Immigrants from India (92.0%, a difference of 0.0%), Slovene (92.0%, a difference of 0.020%), Chinese (92.0%, a difference of 0.020%), Latvian (92.0%, a difference of 0.030%), and Croatian (92.0%, a difference of 0.060%).
| Demographics | Rating | Rank | High School Diploma |
| Slovenes | 100.0 /100 | #5 | Exceptional 92.0% |
| Slovaks | 100.0 /100 | #6 | Exceptional 92.0% |
| Immigrants | India | 100.0 /100 | #7 | Exceptional 92.0% |
| Chinese | 100.0 /100 | #8 | Exceptional 92.0% |
| Latvians | 100.0 /100 | #9 | Exceptional 92.0% |
| Croatians | 100.0 /100 | #10 | Exceptional 92.0% |
| Eastern Europeans | 100.0 /100 | #11 | Exceptional 91.9% |
| Poles | 100.0 /100 | #12 | Exceptional 91.9% |
| Danes | 100.0 /100 | #13 | Exceptional 91.8% |
| Bulgarians | 100.0 /100 | #14 | Exceptional 91.8% |
| Luxembourgers | 100.0 /100 | #15 | Exceptional 91.7% |
| Finns | 100.0 /100 | #16 | Exceptional 91.7% |
| Immigrants | Singapore | 99.9 /100 | #17 | Exceptional 91.7% |
| Germans | 99.9 /100 | #18 | Exceptional 91.7% |
| Maltese | 99.9 /100 | #19 | Exceptional 91.6% |
| Czechs | 99.9 /100 | #20 | Exceptional 91.6% |
| Filipinos | 99.9 /100 | #21 | Exceptional 91.6% |
| Estonians | 99.9 /100 | #22 | Exceptional 91.6% |
| Scandinavians | 99.9 /100 | #23 | Exceptional 91.5% |
| Italians | 99.9 /100 | #24 | Exceptional 91.5% |
| Thais | 99.9 /100 | #25 | Exceptional 91.5% |