Israeli vs Immigrants from Guyana 4 or more Vehicles in Household
COMPARE
Israeli
Immigrants from Guyana
4 or more Vehicles in Household
4 or more Vehicles in Household Comparison
Israelis
Immigrants from Guyana
5.2%
4 OR MORE VEHICLES IN HOUSEHOLD
0.1/ 100
METRIC RATING
296th/ 347
METRIC RANK
3.4%
4 OR MORE VEHICLES IN HOUSEHOLD
0.0/ 100
METRIC RATING
344th/ 347
METRIC RANK
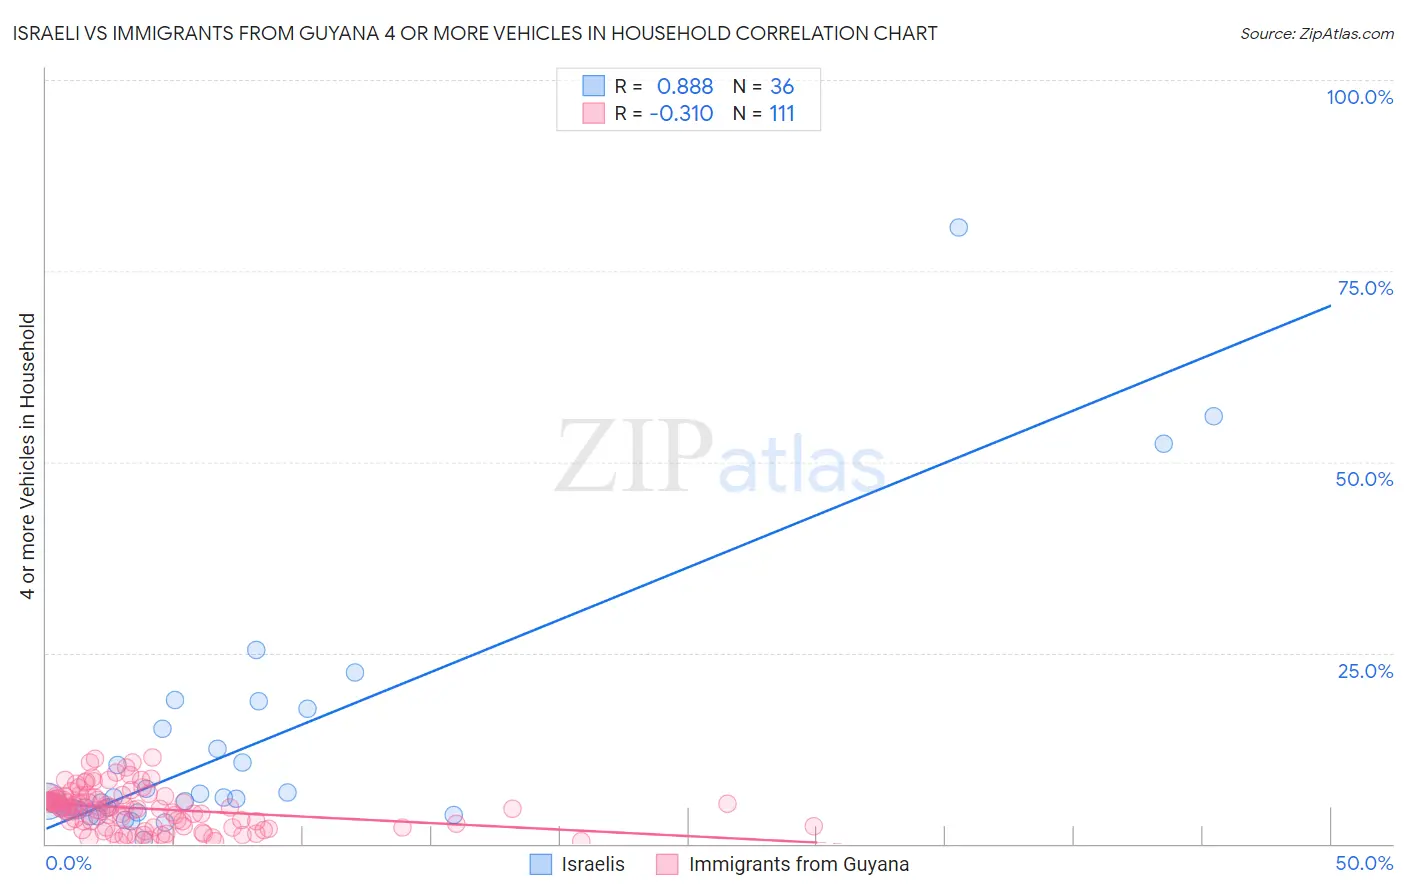
Israeli vs Immigrants from Guyana 4 or more Vehicles in Household Correlation Chart
The statistical analysis conducted on geographies consisting of 209,765,898 people shows a very strong positive correlation between the proportion of Israelis and percentage of households with 4 or more vehicles available in the United States with a correlation coefficient (R) of 0.888 and weighted average of 5.2%. Similarly, the statistical analysis conducted on geographies consisting of 182,580,983 people shows a mild negative correlation between the proportion of Immigrants from Guyana and percentage of households with 4 or more vehicles available in the United States with a correlation coefficient (R) of -0.310 and weighted average of 3.4%, a difference of 53.9%.
4 or more Vehicles in Household Correlation Summary
| Measurement | Israeli | Immigrants from Guyana |
| Minimum | 0.51% | 0.29% |
| Maximum | 80.8% | 11.2% |
| Range | 80.3% | 10.9% |
| Mean | 12.6% | 4.6% |
| Median | 5.7% | 4.6% |
| Interquartile 25% (IQ1) | 4.4% | 2.2% |
| Interquartile 75% (IQ3) | 13.7% | 6.2% |
| Interquartile Range (IQR) | 9.3% | 4.0% |
| Standard Deviation (Sample) | 16.9% | 2.6% |
| Standard Deviation (Population) | 16.7% | 2.6% |
Similar Demographics by 4 or more Vehicles in Household
Demographics Similar to Israelis by 4 or more Vehicles in Household
In terms of 4 or more vehicles in household, the demographic groups most similar to Israelis are Immigrants from Brazil (5.2%, a difference of 0.18%), Ghanaian (5.2%, a difference of 0.29%), Immigrants from Venezuela (5.2%, a difference of 0.29%), Immigrants from Congo (5.2%, a difference of 0.35%), and Liberian (5.3%, a difference of 0.38%).
| Demographics | Rating | Rank | 4 or more Vehicles in Household |
| Immigrants | Bosnia and Herzegovina | 0.2 /100 | #289 | Tragic 5.3% |
| Immigrants | Russia | 0.2 /100 | #290 | Tragic 5.3% |
| Immigrants | Bahamas | 0.1 /100 | #291 | Tragic 5.3% |
| Liberians | 0.1 /100 | #292 | Tragic 5.3% |
| Immigrants | Congo | 0.1 /100 | #293 | Tragic 5.2% |
| Ghanaians | 0.1 /100 | #294 | Tragic 5.2% |
| Immigrants | Brazil | 0.1 /100 | #295 | Tragic 5.2% |
| Israelis | 0.1 /100 | #296 | Tragic 5.2% |
| Immigrants | Venezuela | 0.1 /100 | #297 | Tragic 5.2% |
| Immigrants | South America | 0.1 /100 | #298 | Tragic 5.2% |
| Immigrants | Ghana | 0.1 /100 | #299 | Tragic 5.2% |
| Immigrants | Morocco | 0.0 /100 | #300 | Tragic 5.1% |
| Immigrants | Zaire | 0.0 /100 | #301 | Tragic 5.1% |
| Bahamians | 0.0 /100 | #302 | Tragic 5.1% |
| Immigrants | Greece | 0.0 /100 | #303 | Tragic 5.1% |
Demographics Similar to Immigrants from Guyana by 4 or more Vehicles in Household
In terms of 4 or more vehicles in household, the demographic groups most similar to Immigrants from Guyana are British West Indian (3.5%, a difference of 1.6%), Guyanese (3.5%, a difference of 2.6%), Dominican (3.5%, a difference of 3.3%), Immigrants from Dominican Republic (3.3%, a difference of 4.1%), and Immigrants from Barbados (3.6%, a difference of 6.1%).
| Demographics | Rating | Rank | 4 or more Vehicles in Household |
| Immigrants | Albania | 0.0 /100 | #333 | Tragic 4.1% |
| Immigrants | Trinidad and Tobago | 0.0 /100 | #334 | Tragic 4.1% |
| Barbadians | 0.0 /100 | #335 | Tragic 3.9% |
| Immigrants | Bangladesh | 0.0 /100 | #336 | Tragic 3.9% |
| Vietnamese | 0.0 /100 | #337 | Tragic 3.9% |
| Immigrants | Cabo Verde | 0.0 /100 | #338 | Tragic 3.8% |
| Immigrants | Uzbekistan | 0.0 /100 | #339 | Tragic 3.6% |
| Immigrants | Barbados | 0.0 /100 | #340 | Tragic 3.6% |
| Dominicans | 0.0 /100 | #341 | Tragic 3.5% |
| Guyanese | 0.0 /100 | #342 | Tragic 3.5% |
| British West Indians | 0.0 /100 | #343 | Tragic 3.5% |
| Immigrants | Guyana | 0.0 /100 | #344 | Tragic 3.4% |
| Immigrants | Dominican Republic | 0.0 /100 | #345 | Tragic 3.3% |
| Immigrants | St. Vincent and the Grenadines | 0.0 /100 | #346 | Tragic 3.0% |
| Immigrants | Grenada | 0.0 /100 | #347 | Tragic 2.7% |