Israeli vs Ethiopian 4 or more Vehicles in Household
COMPARE
Israeli
Ethiopian
4 or more Vehicles in Household
4 or more Vehicles in Household Comparison
Israelis
Ethiopians
5.2%
4 OR MORE VEHICLES IN HOUSEHOLD
0.1/ 100
METRIC RATING
296th/ 347
METRIC RANK
5.8%
4 OR MORE VEHICLES IN HOUSEHOLD
3.2/ 100
METRIC RATING
244th/ 347
METRIC RANK
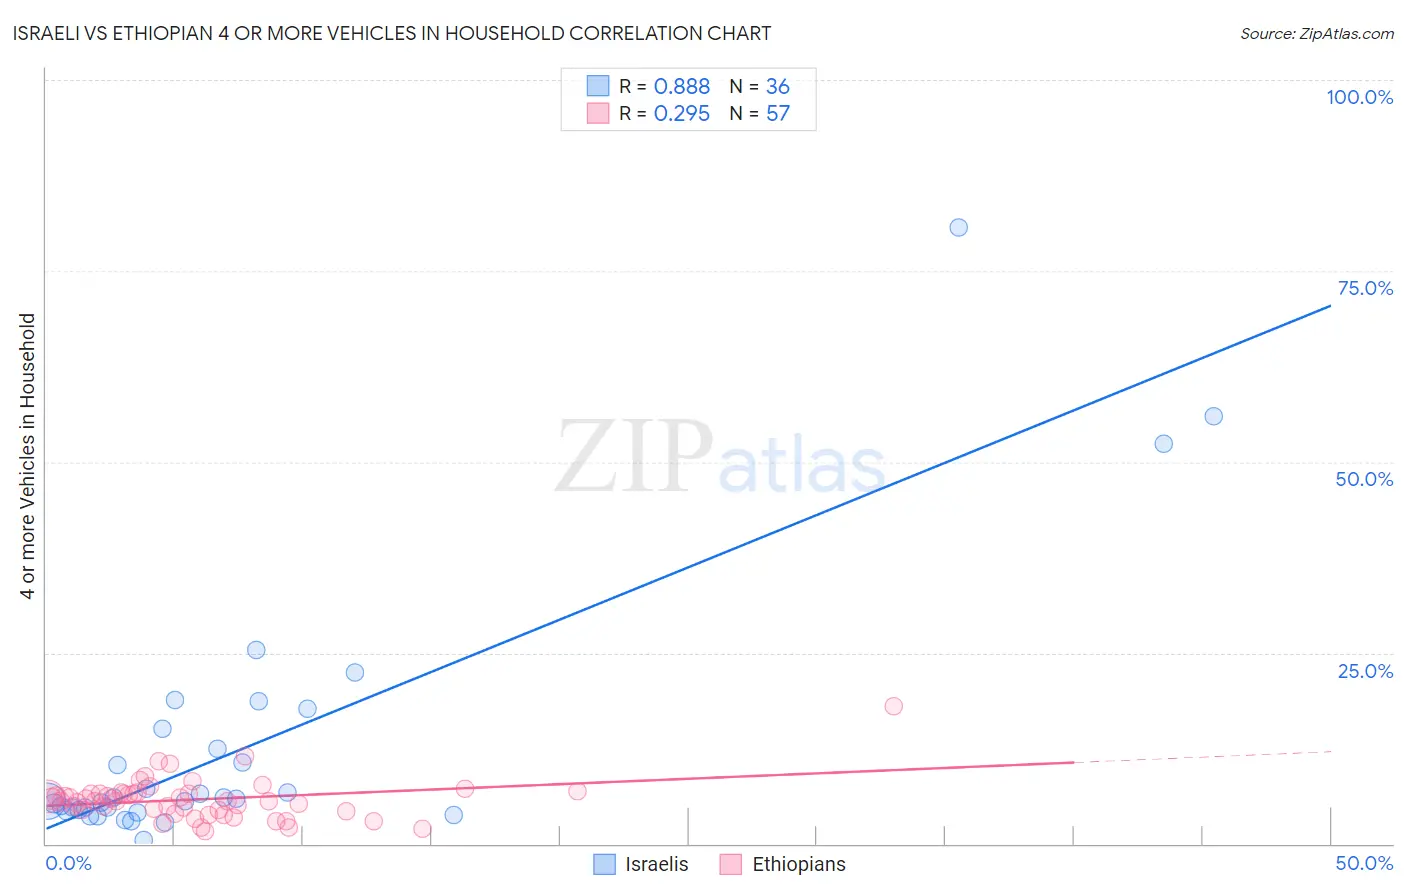
Israeli vs Ethiopian 4 or more Vehicles in Household Correlation Chart
The statistical analysis conducted on geographies consisting of 209,765,898 people shows a very strong positive correlation between the proportion of Israelis and percentage of households with 4 or more vehicles available in the United States with a correlation coefficient (R) of 0.888 and weighted average of 5.2%. Similarly, the statistical analysis conducted on geographies consisting of 222,112,798 people shows a weak positive correlation between the proportion of Ethiopians and percentage of households with 4 or more vehicles available in the United States with a correlation coefficient (R) of 0.295 and weighted average of 5.8%, a difference of 10.5%.
4 or more Vehicles in Household Correlation Summary
| Measurement | Israeli | Ethiopian |
| Minimum | 0.51% | 1.6% |
| Maximum | 80.8% | 18.0% |
| Range | 80.3% | 16.4% |
| Mean | 12.6% | 5.8% |
| Median | 5.7% | 5.6% |
| Interquartile 25% (IQ1) | 4.4% | 4.3% |
| Interquartile 75% (IQ3) | 13.7% | 6.5% |
| Interquartile Range (IQR) | 9.3% | 2.2% |
| Standard Deviation (Sample) | 16.9% | 2.7% |
| Standard Deviation (Population) | 16.7% | 2.6% |
Similar Demographics by 4 or more Vehicles in Household
Demographics Similar to Israelis by 4 or more Vehicles in Household
In terms of 4 or more vehicles in household, the demographic groups most similar to Israelis are Immigrants from Brazil (5.2%, a difference of 0.18%), Ghanaian (5.2%, a difference of 0.29%), Immigrants from Venezuela (5.2%, a difference of 0.29%), Immigrants from Congo (5.2%, a difference of 0.35%), and Liberian (5.3%, a difference of 0.38%).
| Demographics | Rating | Rank | 4 or more Vehicles in Household |
| Immigrants | Bosnia and Herzegovina | 0.2 /100 | #289 | Tragic 5.3% |
| Immigrants | Russia | 0.2 /100 | #290 | Tragic 5.3% |
| Immigrants | Bahamas | 0.1 /100 | #291 | Tragic 5.3% |
| Liberians | 0.1 /100 | #292 | Tragic 5.3% |
| Immigrants | Congo | 0.1 /100 | #293 | Tragic 5.2% |
| Ghanaians | 0.1 /100 | #294 | Tragic 5.2% |
| Immigrants | Brazil | 0.1 /100 | #295 | Tragic 5.2% |
| Israelis | 0.1 /100 | #296 | Tragic 5.2% |
| Immigrants | Venezuela | 0.1 /100 | #297 | Tragic 5.2% |
| Immigrants | South America | 0.1 /100 | #298 | Tragic 5.2% |
| Immigrants | Ghana | 0.1 /100 | #299 | Tragic 5.2% |
| Immigrants | Morocco | 0.0 /100 | #300 | Tragic 5.1% |
| Immigrants | Zaire | 0.0 /100 | #301 | Tragic 5.1% |
| Bahamians | 0.0 /100 | #302 | Tragic 5.1% |
| Immigrants | Greece | 0.0 /100 | #303 | Tragic 5.1% |
Demographics Similar to Ethiopians by 4 or more Vehicles in Household
In terms of 4 or more vehicles in household, the demographic groups most similar to Ethiopians are Immigrants from Czechoslovakia (5.8%, a difference of 0.010%), Bulgarian (5.8%, a difference of 0.040%), Immigrants from Middle Africa (5.8%, a difference of 0.20%), Mongolian (5.8%, a difference of 0.41%), and Immigrants from Poland (5.8%, a difference of 0.50%).
| Demographics | Rating | Rank | 4 or more Vehicles in Household |
| Turks | 4.1 /100 | #237 | Tragic 5.8% |
| Immigrants | Belgium | 4.0 /100 | #238 | Tragic 5.8% |
| Immigrants | Australia | 3.8 /100 | #239 | Tragic 5.8% |
| Immigrants | Poland | 3.8 /100 | #240 | Tragic 5.8% |
| Mongolians | 3.7 /100 | #241 | Tragic 5.8% |
| Immigrants | Middle Africa | 3.4 /100 | #242 | Tragic 5.8% |
| Immigrants | Czechoslovakia | 3.2 /100 | #243 | Tragic 5.8% |
| Ethiopians | 3.2 /100 | #244 | Tragic 5.8% |
| Bulgarians | 3.1 /100 | #245 | Tragic 5.8% |
| Immigrants | North Macedonia | 2.5 /100 | #246 | Tragic 5.7% |
| Immigrants | Ethiopia | 2.4 /100 | #247 | Tragic 5.7% |
| Immigrants | Eastern Africa | 2.4 /100 | #248 | Tragic 5.7% |
| Immigrants | Southern Europe | 2.3 /100 | #249 | Tragic 5.7% |
| Immigrants | Europe | 2.3 /100 | #250 | Tragic 5.7% |
| Ugandans | 2.2 /100 | #251 | Tragic 5.7% |