Israeli vs Immigrants from Kuwait 4 or more Vehicles in Household
COMPARE
Israeli
Immigrants from Kuwait
4 or more Vehicles in Household
4 or more Vehicles in Household Comparison
Israelis
Immigrants from Kuwait
5.2%
4 OR MORE VEHICLES IN HOUSEHOLD
0.1/ 100
METRIC RATING
296th/ 347
METRIC RANK
6.2%
4 OR MORE VEHICLES IN HOUSEHOLD
28.0/ 100
METRIC RATING
193rd/ 347
METRIC RANK
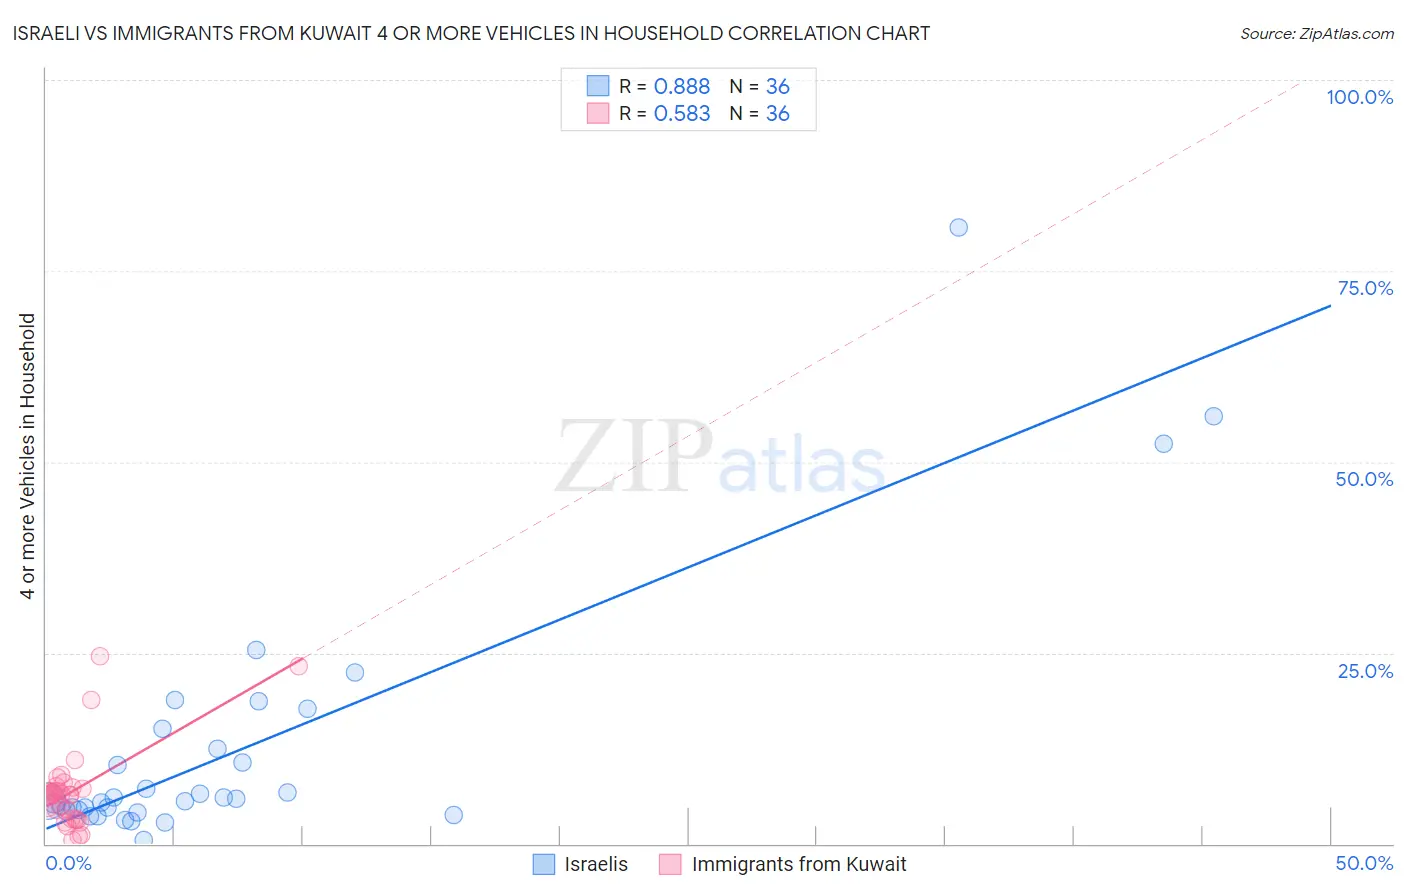
Israeli vs Immigrants from Kuwait 4 or more Vehicles in Household Correlation Chart
The statistical analysis conducted on geographies consisting of 209,765,898 people shows a very strong positive correlation between the proportion of Israelis and percentage of households with 4 or more vehicles available in the United States with a correlation coefficient (R) of 0.888 and weighted average of 5.2%. Similarly, the statistical analysis conducted on geographies consisting of 136,548,104 people shows a substantial positive correlation between the proportion of Immigrants from Kuwait and percentage of households with 4 or more vehicles available in the United States with a correlation coefficient (R) of 0.583 and weighted average of 6.2%, a difference of 18.0%.
4 or more Vehicles in Household Correlation Summary
| Measurement | Israeli | Immigrants from Kuwait |
| Minimum | 0.51% | 0.56% |
| Maximum | 80.8% | 24.6% |
| Range | 80.3% | 24.1% |
| Mean | 12.6% | 6.9% |
| Median | 5.7% | 6.4% |
| Interquartile 25% (IQ1) | 4.4% | 3.3% |
| Interquartile 75% (IQ3) | 13.7% | 7.3% |
| Interquartile Range (IQR) | 9.3% | 4.1% |
| Standard Deviation (Sample) | 16.9% | 5.3% |
| Standard Deviation (Population) | 16.7% | 5.2% |
Similar Demographics by 4 or more Vehicles in Household
Demographics Similar to Israelis by 4 or more Vehicles in Household
In terms of 4 or more vehicles in household, the demographic groups most similar to Israelis are Immigrants from Brazil (5.2%, a difference of 0.18%), Ghanaian (5.2%, a difference of 0.29%), Immigrants from Venezuela (5.2%, a difference of 0.29%), Immigrants from Congo (5.2%, a difference of 0.35%), and Liberian (5.3%, a difference of 0.38%).
| Demographics | Rating | Rank | 4 or more Vehicles in Household |
| Immigrants | Bosnia and Herzegovina | 0.2 /100 | #289 | Tragic 5.3% |
| Immigrants | Russia | 0.2 /100 | #290 | Tragic 5.3% |
| Immigrants | Bahamas | 0.1 /100 | #291 | Tragic 5.3% |
| Liberians | 0.1 /100 | #292 | Tragic 5.3% |
| Immigrants | Congo | 0.1 /100 | #293 | Tragic 5.2% |
| Ghanaians | 0.1 /100 | #294 | Tragic 5.2% |
| Immigrants | Brazil | 0.1 /100 | #295 | Tragic 5.2% |
| Israelis | 0.1 /100 | #296 | Tragic 5.2% |
| Immigrants | Venezuela | 0.1 /100 | #297 | Tragic 5.2% |
| Immigrants | South America | 0.1 /100 | #298 | Tragic 5.2% |
| Immigrants | Ghana | 0.1 /100 | #299 | Tragic 5.2% |
| Immigrants | Morocco | 0.0 /100 | #300 | Tragic 5.1% |
| Immigrants | Zaire | 0.0 /100 | #301 | Tragic 5.1% |
| Bahamians | 0.0 /100 | #302 | Tragic 5.1% |
| Immigrants | Greece | 0.0 /100 | #303 | Tragic 5.1% |
Demographics Similar to Immigrants from Kuwait by 4 or more Vehicles in Household
In terms of 4 or more vehicles in household, the demographic groups most similar to Immigrants from Kuwait are Immigrants from Sweden (6.2%, a difference of 0.13%), Argentinean (6.2%, a difference of 0.13%), Tsimshian (6.2%, a difference of 0.20%), Romanian (6.2%, a difference of 0.34%), and Inupiat (6.2%, a difference of 0.35%).
| Demographics | Rating | Rank | 4 or more Vehicles in Household |
| Immigrants | Northern Europe | 36.8 /100 | #186 | Fair 6.2% |
| Immigrants | South Africa | 35.4 /100 | #187 | Fair 6.2% |
| Kiowa | 34.7 /100 | #188 | Fair 6.2% |
| Immigrants | Eastern Asia | 33.3 /100 | #189 | Fair 6.2% |
| South Africans | 32.2 /100 | #190 | Fair 6.2% |
| Inupiat | 30.7 /100 | #191 | Fair 6.2% |
| Romanians | 30.7 /100 | #192 | Fair 6.2% |
| Immigrants | Kuwait | 28.0 /100 | #193 | Fair 6.2% |
| Immigrants | Sweden | 27.0 /100 | #194 | Fair 6.2% |
| Argentineans | 27.0 /100 | #195 | Fair 6.2% |
| Tsimshian | 26.4 /100 | #196 | Fair 6.2% |
| Immigrants | Sri Lanka | 23.7 /100 | #197 | Fair 6.1% |
| Immigrants | Portugal | 22.3 /100 | #198 | Fair 6.1% |
| Immigrants | Norway | 21.8 /100 | #199 | Fair 6.1% |
| Latvians | 21.7 /100 | #200 | Fair 6.1% |