Israeli vs Immigrants from Kuwait Disability Age Under 5
COMPARE
Israeli
Immigrants from Kuwait
Disability Age Under 5
Disability Age Under 5 Comparison
Israelis
Immigrants from Kuwait
1.1%
DISABILITY AGE UNDER 5
98.7/ 100
METRIC RATING
69th/ 347
METRIC RANK
1.2%
DISABILITY AGE UNDER 5
62.6/ 100
METRIC RATING
165th/ 347
METRIC RANK
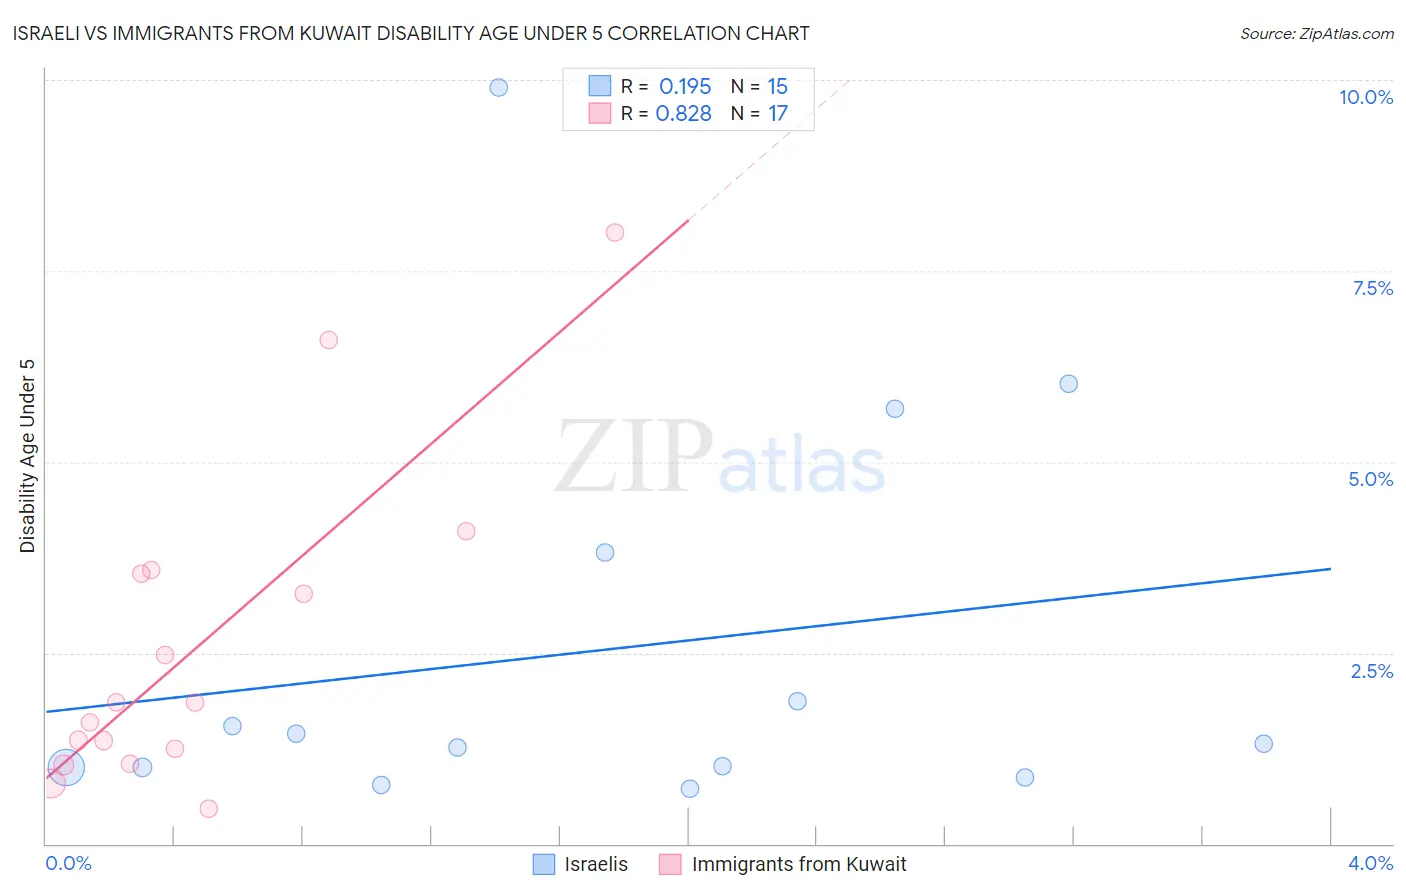
Israeli vs Immigrants from Kuwait Disability Age Under 5 Correlation Chart
The statistical analysis conducted on geographies consisting of 133,940,307 people shows a poor positive correlation between the proportion of Israelis and percentage of population with a disability under the age of 5 in the United States with a correlation coefficient (R) of 0.195 and weighted average of 1.1%. Similarly, the statistical analysis conducted on geographies consisting of 100,801,257 people shows a very strong positive correlation between the proportion of Immigrants from Kuwait and percentage of population with a disability under the age of 5 in the United States with a correlation coefficient (R) of 0.828 and weighted average of 1.2%, a difference of 9.5%.
Disability Age Under 5 Correlation Summary
| Measurement | Israeli | Immigrants from Kuwait |
| Minimum | 0.72% | 0.45% |
| Maximum | 9.9% | 8.0% |
| Range | 9.2% | 7.5% |
| Mean | 2.5% | 2.6% |
| Median | 1.3% | 1.8% |
| Interquartile 25% (IQ1) | 1.00% | 1.1% |
| Interquartile 75% (IQ3) | 3.8% | 3.6% |
| Interquartile Range (IQR) | 2.8% | 2.4% |
| Standard Deviation (Sample) | 2.7% | 2.1% |
| Standard Deviation (Population) | 2.6% | 2.0% |
Similar Demographics by Disability Age Under 5
Demographics Similar to Israelis by Disability Age Under 5
In terms of disability age under 5, the demographic groups most similar to Israelis are South African (1.1%, a difference of 0.030%), Immigrants from Belize (1.1%, a difference of 0.060%), Immigrants from Ecuador (1.1%, a difference of 0.090%), Immigrants from Indonesia (1.1%, a difference of 0.13%), and Trinidadian and Tobagonian (1.1%, a difference of 0.15%).
| Demographics | Rating | Rank | Disability Age Under 5 |
| Immigrants | Switzerland | 99.2 /100 | #62 | Exceptional 1.1% |
| Immigrants | Vietnam | 99.1 /100 | #63 | Exceptional 1.1% |
| Egyptians | 98.9 /100 | #64 | Exceptional 1.1% |
| Immigrants | Korea | 98.8 /100 | #65 | Exceptional 1.1% |
| Immigrants | Indonesia | 98.7 /100 | #66 | Exceptional 1.1% |
| Immigrants | Belize | 98.7 /100 | #67 | Exceptional 1.1% |
| South Africans | 98.7 /100 | #68 | Exceptional 1.1% |
| Israelis | 98.7 /100 | #69 | Exceptional 1.1% |
| Immigrants | Ecuador | 98.6 /100 | #70 | Exceptional 1.1% |
| Trinidadians and Tobagonians | 98.6 /100 | #71 | Exceptional 1.1% |
| Burmese | 98.5 /100 | #72 | Exceptional 1.1% |
| Immigrants | Sri Lanka | 98.5 /100 | #73 | Exceptional 1.1% |
| Jordanians | 98.5 /100 | #74 | Exceptional 1.1% |
| Immigrants | Pakistan | 98.4 /100 | #75 | Exceptional 1.1% |
| Immigrants | Burma/Myanmar | 98.2 /100 | #76 | Exceptional 1.1% |
Demographics Similar to Immigrants from Kuwait by Disability Age Under 5
In terms of disability age under 5, the demographic groups most similar to Immigrants from Kuwait are Laotian (1.2%, a difference of 0.020%), Immigrants from Guatemala (1.2%, a difference of 0.070%), Guatemalan (1.2%, a difference of 0.10%), Immigrants from Central America (1.2%, a difference of 0.11%), and Immigrants from Argentina (1.2%, a difference of 0.22%).
| Demographics | Rating | Rank | Disability Age Under 5 |
| Arabs | 66.4 /100 | #158 | Good 1.2% |
| Colombians | 65.8 /100 | #159 | Good 1.2% |
| Immigrants | Latin America | 65.8 /100 | #160 | Good 1.2% |
| Immigrants | Africa | 65.1 /100 | #161 | Good 1.2% |
| Guatemalans | 63.6 /100 | #162 | Good 1.2% |
| Immigrants | Guatemala | 63.2 /100 | #163 | Good 1.2% |
| Laotians | 62.8 /100 | #164 | Good 1.2% |
| Immigrants | Kuwait | 62.6 /100 | #165 | Good 1.2% |
| Immigrants | Central America | 61.4 /100 | #166 | Good 1.2% |
| Immigrants | Argentina | 60.2 /100 | #167 | Good 1.2% |
| Sierra Leoneans | 59.1 /100 | #168 | Average 1.2% |
| Immigrants | Uruguay | 59.0 /100 | #169 | Average 1.2% |
| Immigrants | Jamaica | 58.8 /100 | #170 | Average 1.2% |
| Guamanians/Chamorros | 57.8 /100 | #171 | Average 1.2% |
| Crow | 51.0 /100 | #172 | Average 1.2% |